
Net Present Value (NPV) Calculator
Introduction
There's a moment in every serious investment decision when intuition alone stops being enough and that's precisely where net present value earns its place. Unlike surface-level profitability checks, NPV forces a reckoning with time: the uncomfortable truth that a dollar today is categorically different from a dollar promised tomorrow. This principle, known as the time value of money, isn't abstract theory; it's the reason seasoned analysts discount every projected cash flow back to what it's actually worth at time 0, before a single cent changes hands.
What separates NPV from other capital budgeting tools isn't complexity, it's honesty. When an organization runs an NPV calculation, it's asking a direct question: do the discounted inflows justify the initial investment, or does the result expose a loss hiding behind optimistic forecasts? A positive NPV signals a project worth pursuing; a negative NPV makes the case for rejection before capital is misallocated. I've watched teams greenlight expansions simply because revenue projections looked promising only to realize later that time-adjusted outflows had quietly swallowed the profit. NPV doesn't let that happen. It anchors every financial decision to the present value of future cash flows, giving decision-makers an informed, quantitative basis for resource allocation rather than gut feeling.
What Is Net Present Value (NPV)?
At its core, net present value is a quantitative measure that calculates the difference between cash inflows and cash outflows over a defined time period, anchoring every future dollar back to its present value. Practitioners use it not merely as a calculator or tool, but as a structured lens for financial decision-making, one that bakes inflation, risk, and the time-value of money directly into a single dollar figure. Whether you are evaluating dynamic investments or weighing project alternatives, NPV tells you whether money deployed today will generate profit or result in loss once every discounted dollar of revenue and expenses is honestly accounted for. The elegance lies in its comparability: it reduces competing investment options into a common unit, making the decision almost self-evident.
What separates NPV from surface-level payback metrics is its respect for capital costs and the sequential reality of consecutive periods. A positive result signals value creation; a negative or zero figure warns of a breakeven at best or a disadvantageous deployment of capital budgeting resources at worst. I have personally seen teams skip the discounting step entirely and wonder why their financial planning unraveled because ignoring inflows and outflows across time is precisely where budget allocation goes wrong. By treating every cash value as what it is actually worth in the present day, NPV converts abstract profitability projections into informed decisions with real accountability. It also serves as the foundation for broader frameworks like discounted cash flow (DCF) analysis and the profitability index, making it indispensable across capital allocation scenarios from approving assets to stress-testing a full simulation against a defined decision-band.
Net Present Value NPV Formula
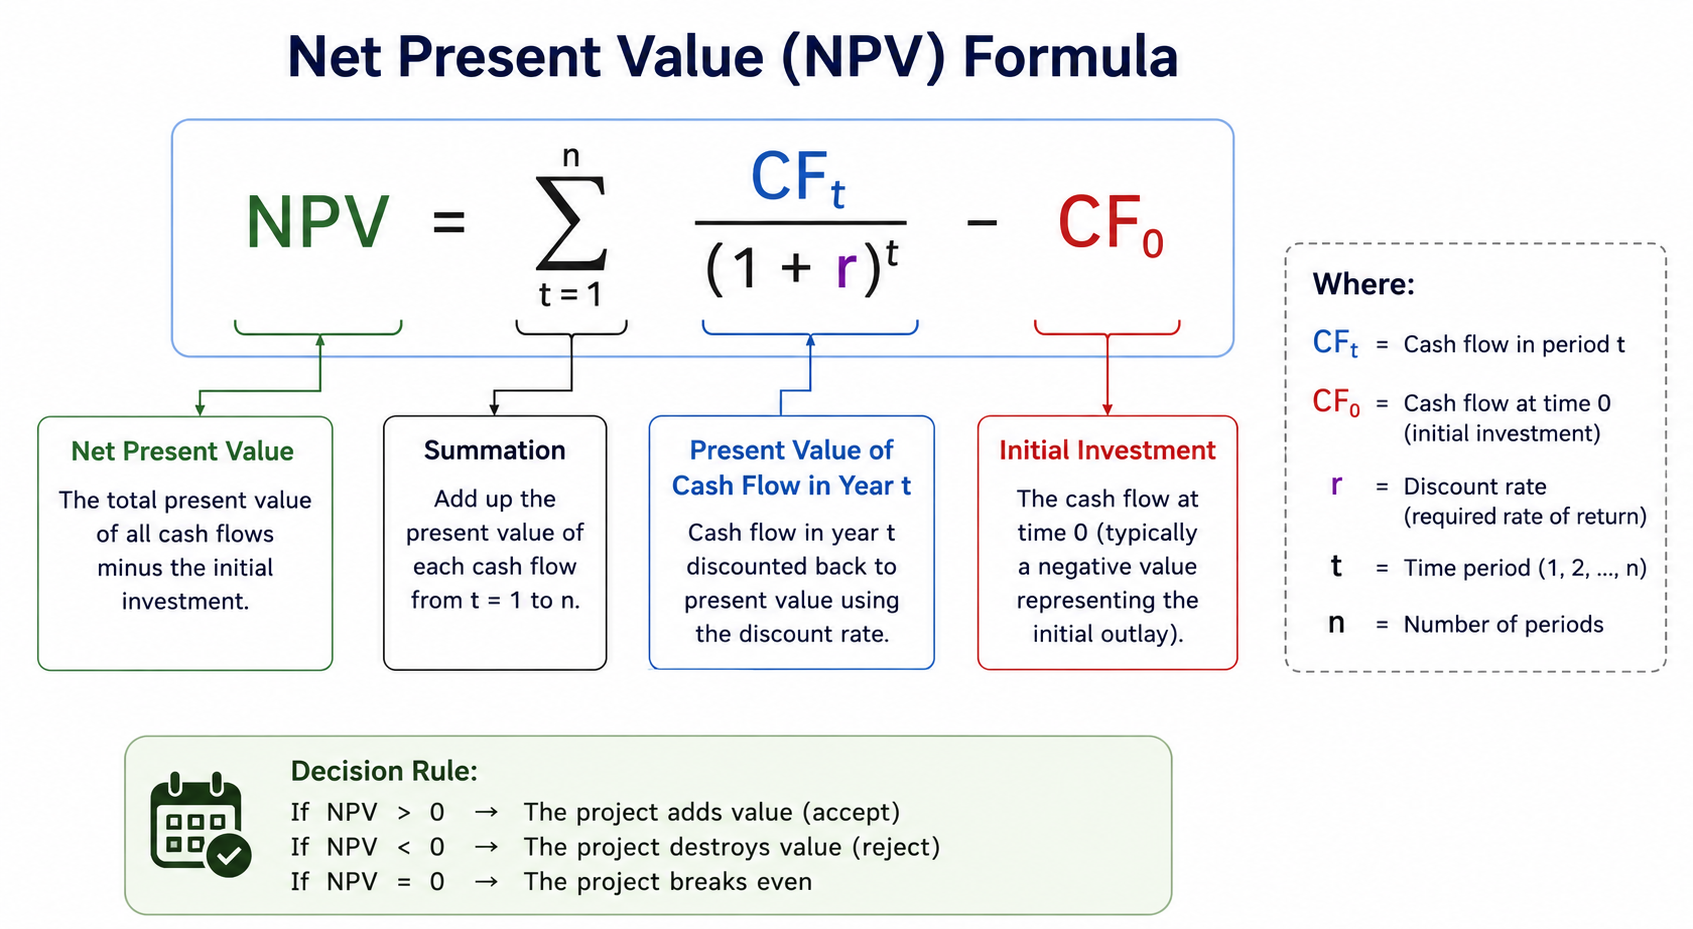
The formula itself is deceptively straightforward, yet it encodes something most financial practitioners underestimate the full weight of time compressed into a single arithmetic expression. At its core, you're deducting an initial investment from the sum of all inflows discounted and outflows discounted across every period. Each cash inflow and cash outflow gets pulled back to today's value using a chosen discount rate, making the cost of capital the silent multiplier that either validates or dissolves a project's profitability analysis. In practice, I've seen teams run the numbers and land at zero NPV not a failure, but a breakeven signal worth pausing on, because at that rate of return, the business is essentially indifferent to whether the project accepted or project rejected outcome is pursued.
What separates informed use of this formula from mechanical application is understanding that periods aren't interchangeable; a dollar recovered in a year carries fundamentally different weight than one arriving three years out, and the rate you select is the axis everything rotates around. The budgeting tools built on this logic force a discipline that narrative forecasts never can: every cost, every projected recovery, every assumption about cash inflows must survive the discount. Whether you're evaluating a capital expansion decision or stress-testing a long-term commitment, the formula's power lies in making the invisible cost of waiting mathematically visible and in doing so, it becomes one of the most honest investment decision frameworks available to practitioners who know how to read what it's actually saying.
How to Calculate NPV
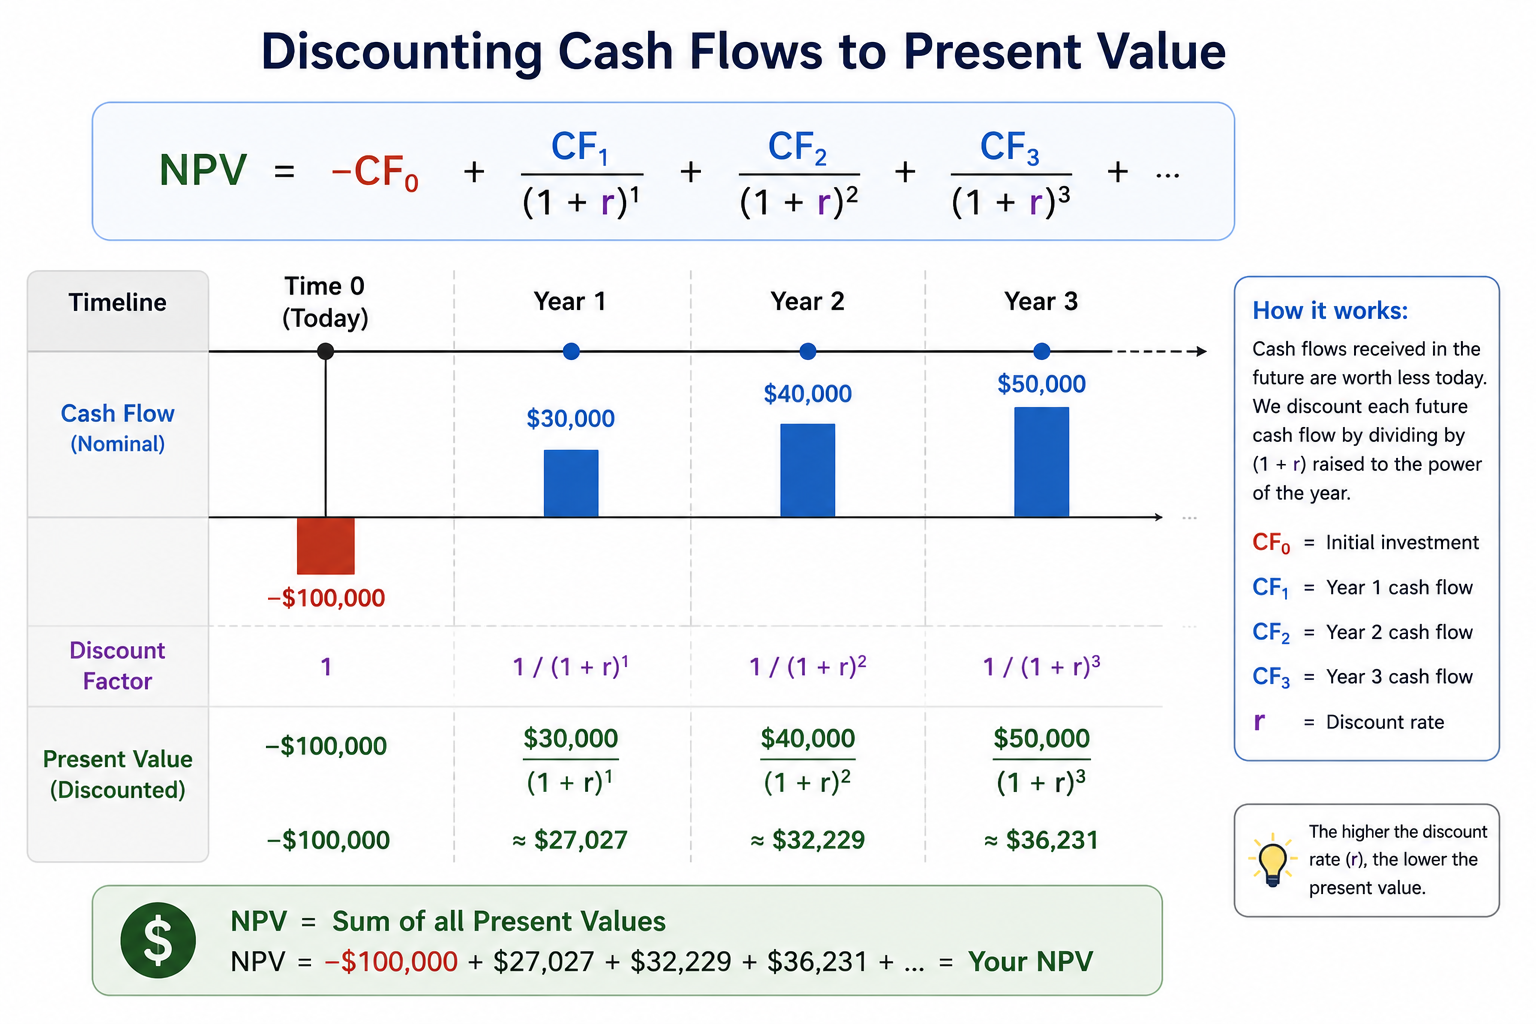
Calculating NPV begins not where most guides start with formulas but with a harder question: what is this investment actually worth in today's terms? The present value of any future cash flows erodes over time, and that erosion is precisely what the NPV equation captures. You identify your initial investment as C₀, then map each annual cash flow across the investment period whether year 1, year 2, year 3, or beyond and apply a discount rate derived from your cost of capital. The PV of each period is calculated using the present value formula: divide the cash flow by (1 + r)ⁿ, where r is the rate and n is the period index. The sigma notation formalizes this through summation an aggregation of individually discounted values across every period i through t and subtracting C₀ from the total gives you the net figure.
What practitioners rarely discuss is how the step by step mechanics interact with the nature of your inputs. Free cash flow is the correct variable to plug in not gross revenue because using figures that already embed interest leads to double-counting, distorting the compound effect the equation is designed to measure. Whether your inflows are fixed or variable, even or uneven, annual, quarterly, or monthly, the WACC weighted average cost of capital often serves as the most defensible rate of return to apply, factoring in opportunity cost and aligning the formula with what the business actually sacrifices to fund the project. The sum across all discounted periods, minus the upfront outlay, tells you with clarity whether value creation is real or merely projected.
NPV Calculation Example
NPV Result Interpretation Guide
How to Interpret NPV Results
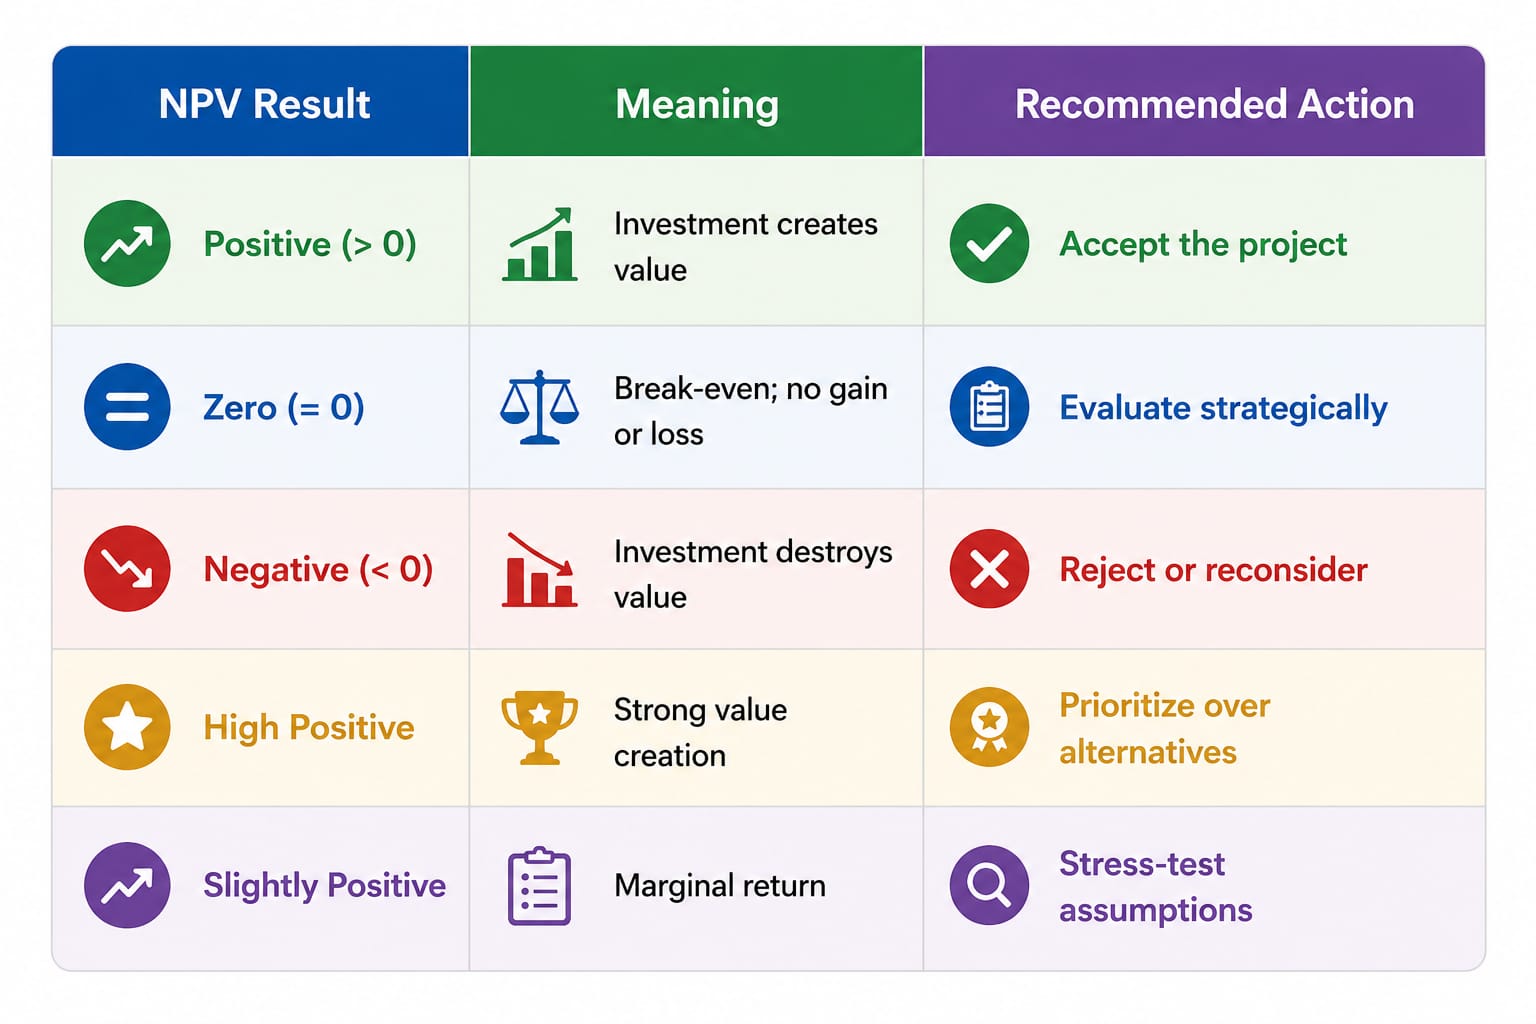
Understanding what your NPV output is actually telling you goes beyond confirming whether a number is positive or negative it demands contextual judgment. A positive NPV signals that cash inflows, when discounted back to their present value, exceed the cash outflows, making the investment genuinely profitable and worthwhile. Yet seasoned practitioners know that a modestly positive result barely clearing the hurdle rate deserves scrutiny especially when projected cash flows rest on estimated figures built from informed assumptions rather than hard data. The time value of money is the silent architect here: every dollar received in a future time period is inherently worth less today, and how aggressively you apply the discount rate will shift your reading of whether a project is advantageous or merely borderline. From personal experience evaluating capital expenditure decisions, the single most overlooked step is stress-testing assumptions on inflows and assumptions on outflows because an inaccurate cost estimate can swing a viable result into a loss without the analyst ever noticing.
Where interpretation gets genuinely nuanced is at the margins: zero NPV means you sit precisely at break-even, neither securing profit nor absorbing a loss the project is indifferent, equally likely to be accepted or rejected depending on strategic context. A negative NPV, meanwhile, doesn't always mean automatic discarded status; sometimes the residual value of assets or non-financial long-term benefits think sustainability projects or IT upgrades justify moving forward despite an unfavorable calculation. Comparing investment alternatives using both NPV and the Profitability Index (PI) adds a critical dimension: a high PI with a ratio above 1 on a limited budget can outrank a larger-dollar project when resources are constrained. The IRR, or internal rate of return, serves as a companion checkpoint if the minimum discount rate at which NPV equals zero sits comfortably above your WACC, that margin communicates a genuine buffer. Always communicate these results alongside the potential weaknesses baked into your method, because a number presented without its limitations is an incomplete story.
What Is the Discount Rate?
Every capital decision carries an implicit question: what does money cost over time? The discount rate is your answer to that. In practice, it functions as the minimum threshold of rate of return that a project must exceed before it justifiably commands any investment. Think of it less as an abstract mathematical constant and more as the firm's honest self-assessment, a number derived from what shareholders realistically expect to gain and what the cash flows you're projecting need to justify. When practitioners build a discounted cash flow model, the discount rate is the single variable that can silently override every other assumption in the analysis; set it too low and marginal projects look attractive, set it too high and legitimate opportunities get buried.
What makes the discount rate genuinely nuanced is that it isn't a single universal figure; it's a negotiated one, shaped by the context of the capital being deployed and the risk profile of the underlying cash flows. A real estate developer evaluating a house acquisition will calibrate it differently than a fund manager benchmarking against a T-Bond yield of 5%. In corporate capital budgeting, teams frequently anchor to the weighted average cost of capital, which blends debt cost with shareholder return expectations into a single financial metric. The discipline of choosing the right rate forces you to surface assumptions that often stay buried: how stable are those projected future cash flows? How variable is the estimated discount rate itself given market conditions? These aren't academic questions, they're what separates a worthwhile analysis from one that merely produces a confident-looking number.
Advantages of NPV
Practitioners who have worked through real capital investment decisions know that not every metric earns its place at the table but NPV consistently does, precisely because it operates on time-adjusted actual dollar value rather than abstract gains. Unlike a formula that flattens timing into irrelevance, NPV accounts for when cash flows received actually land, treating a dollar recovered in Year 1 as categorically different from one arriving in Year 3. That built-in accounting for timing is what separates a disciplined cost-benefit reading from optimistic guesswork. When you are staring at two projects with similar upfront costs and deciding which clears your predefined hurdle rate, the NPV calculator doesn't flinch it forces every projected inflow and outflow through the same discounting lens, surfacing which option delivers the highest positive NPV and therefore the clearest path to profitability.
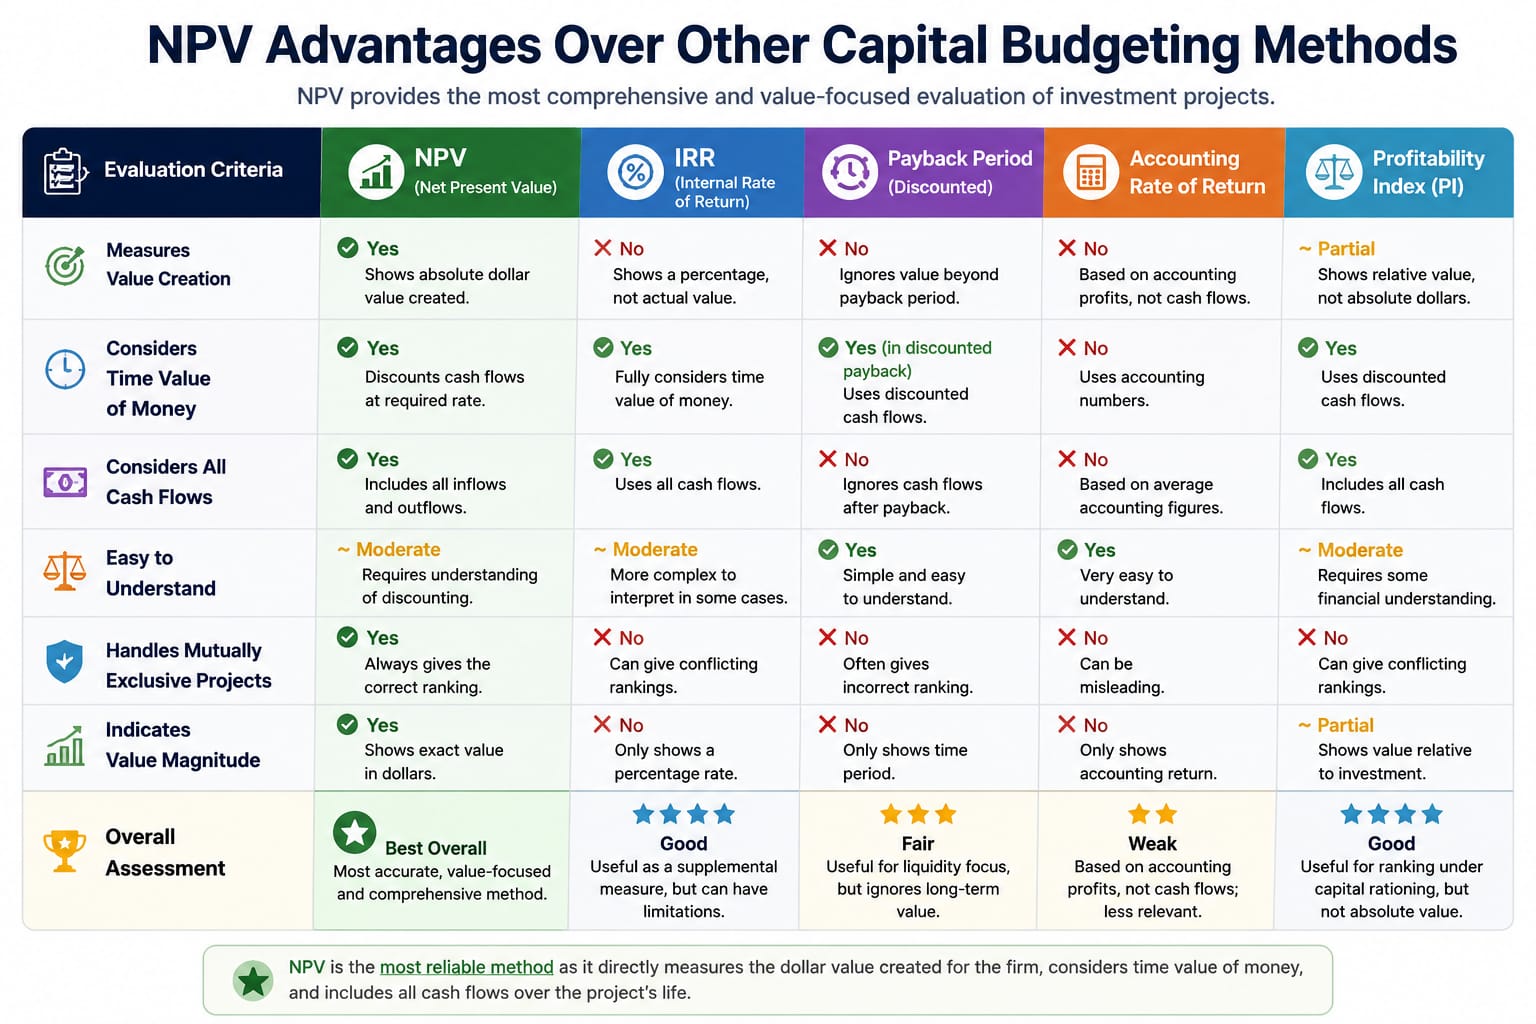
What makes NPV genuinely advantageous over simpler indicators is its capacity to hold an entire investment period in a single, honest number one that reflects expected returns net of expenditure, depreciation, and the weighted average cost of capital that a company actually faces. This matters enormously in project prioritization: whether you are evaluating real estate against a long-term contract, comparing alternative investment paths in mergers and acquisitions, or assessing prospective investments against a risk-free rate, NPV produces a worthwhile, comparable outcome rather than a relative percentage that can mislead when budget sizes differ. The pros here aren't theoretical, they're structural. An acceptable positive result tells you, with the clarity that neither payback alone nor IRR can match, that the company will genuinely gain value, not simply recover its outlay.
Limitations of NPV
Practitioners who have spent years building cash flow tables across variable investment projects often discover something the textbooks don't highlight prominently: the NPV method quietly surfaces its own blind spots the moment you push it beyond controlled conditions. The framework depends almost entirely on expenditures you can identify and estimates you can defend yet real-world scenarios rarely cooperate. Variable expected future cash flows tied to long-term contracts, property taxes, or working capital shifts can swing a profitable outcome into a negative one if the interpretation shifts even slightly. What looks advantageous at a predefined hurdle rate based on current assumptions may become not ideal once those assumptions are adjusted for unexpected circumstances and NPV offers no built-in mechanism to flag that drift. The model calculates; it does not warn. When evaluating alternative investment options such as real estate or patents, where maintenance costs compound across 3 years or longer, even a 6% discount rate applied to uneven annual inflows can distort the NPV result in ways that seem arithmetically sound but are strategically misleading.
There is also a subtler problem that surfaces when NPV is used for project prioritization or ranking across firms engaged in mergers, acquisitions, or competitive valuation. The method assigns a dollar value to outcomes but cannot independently account for scale differences; a $700,000 outlay against a $10,000 annual return reads very differently depending on whether you're a capital-rich acquiring entity or a mid-size operation managing upfront costs against a constrained budget. In those contexts, relying on NPV alone without a companion metric like the Profitability Index risks value loss through miss ranked priorities. Depreciation and accounting treatments further complicate the interpretation: two identical projects can produce divergent NPV figures based purely on how costs are classified in project management systems, especially when double-counting between gross return and net cash flow goes undetected. The calculator gives you a number; what that number means in context is still a judgment call that no formula fully resolves.
Uses and Applications of NPV
Practitioners who've worked across investment projects understand that NPV isn't just a financial metric, it's a planning instrument that forces accounting discipline before capital leaves the table. Where managers might instinctively chase gross return, the NPV framework redirects attention toward future cash flows net of outflows, whether those represent property taxes, working capital demands, or periodic tax payments tied to operations. What separates experienced analysts from first-timers is the recognition that estimates around revenue, expenses, and savings carry real weight; unexpected circumstances and variable conditions across an investment period can erode what looked like positive returns on paper. I've seen teams lock in on a single expected cash flow projection without stress-testing uneven cash flows against a conservative breakeven discount rate, and the outcome rarely favors the company. NPV brings simplicity to what is otherwise a tangle of timing assumptions, converting the entire life of an asset into a dollar value grounded in today's purchasing reality.
Beyond single-project assessment, NPV proves indispensable when the real challenge is ranking alternatives under a constrained budget. Decision-makers use it to run scenario analysis across two projects or an entire pipeline identifying which option is most valuable, which is the second most valuable, and which quietly signals value loss through a negative returns outcome. The comparison doesn't end at selecting the advantageous path; it extends into risk analysis, where the cost of capital and weighted average cost of capital inform whether undertaking a project clears the predefined hurdle rate set by shareholder expectations. Applied alongside a Profitability Index (PI) as a companion metric, NPV enables a comprehensive evaluation that accounts for opportunity cost making it the preferred lens through which experts assess both internal business projects and broader company valuation work.
NPV vs. IRR
When evaluating investment profitability, practitioners in project management and corporate valuation often treat NPV and IRR as interchangeable, a common assumption worth challenging. NPV delivers an exact number: a real dollar difference that anchors analysis to what an alternative investment or alternative project would actually yield in long-term value creation. IRR, by contrast, produces a rate and while that rate may feel intuitive, it dangerously sidesteps double-counting risks, particularly in scenarios where variable cash flows shift in nature or inflows reverse mid-project. I've watched teams select a project based on a higher IRR, only to realize its net cash flow profile was structurally disadvantageous when stacked against the firm's cost of debt and borrowed capital obligations, a situation where NPV would have flagged the choice far more honestly.
The more worthwhile discipline is using NPV as the ideal primary indicator and treating IRR as a secondary lens. Where IRR assumes that interim cash flows are reinvested at the same internal rate, an assumption that rarely survives contact with reality NPV's discounting logic remains grounded in the risk-free rate or a company-specific minimum acceptable rate of return. For firms weighing mergers, acquisitions, long-term contracts, or real estate payback cycles, a project that appears to gain under IRR may still lose money in net present terms once depreciation, maintenance costs, and upfront costs are properly accounted for. This is where NPV calculators, particularly those handling uneven or varying by year cash flows earn their place as the more accurate and interpretation-ready tool for capital decisions.
Profitability Index (PI)
The Profitability Index, a ratio that divides the present value of expected future cash flows by the initial investment, quietly tells you something the raw net present value number alone won't: not just whether a project creates value, but how efficiently each invested dollar does it. Working on capital allocation decisions taught me that chasing the highest absolute NPV can mislead when budgets are constrained; a project returning $10,000 net present value on a $500,000 outlay is far less capital-efficient than one returning the same on $50,000. The PI cuts through that noise. Any result above 1 signals that discounted returns exceed costs the project earns more than the initial investment justifies while a PI of exactly 1 mirrors a zero-NPV breakeven, and anything below 1 flags destruction of shareholder value before a single assumption about the discount rate is even questioned. What practitioners rarely discuss is how PI becomes indispensable during project prioritization and ranking of prospective investments under a fixed capital budget: when two competing projects both show positive NPV, the one with the higher profitability index wins the allocation, because it squeezes more PV return per dollar deployed. The formula itself is elegant in its simplicity PI = (NPV + Initial Investment) ÷ Initial Investment and while tools like Excel and DCF analysis automate the heavier discounting arithmetic, understanding where PI sits relative to net present value keeps the interpretation honest.
How to Use the NPV
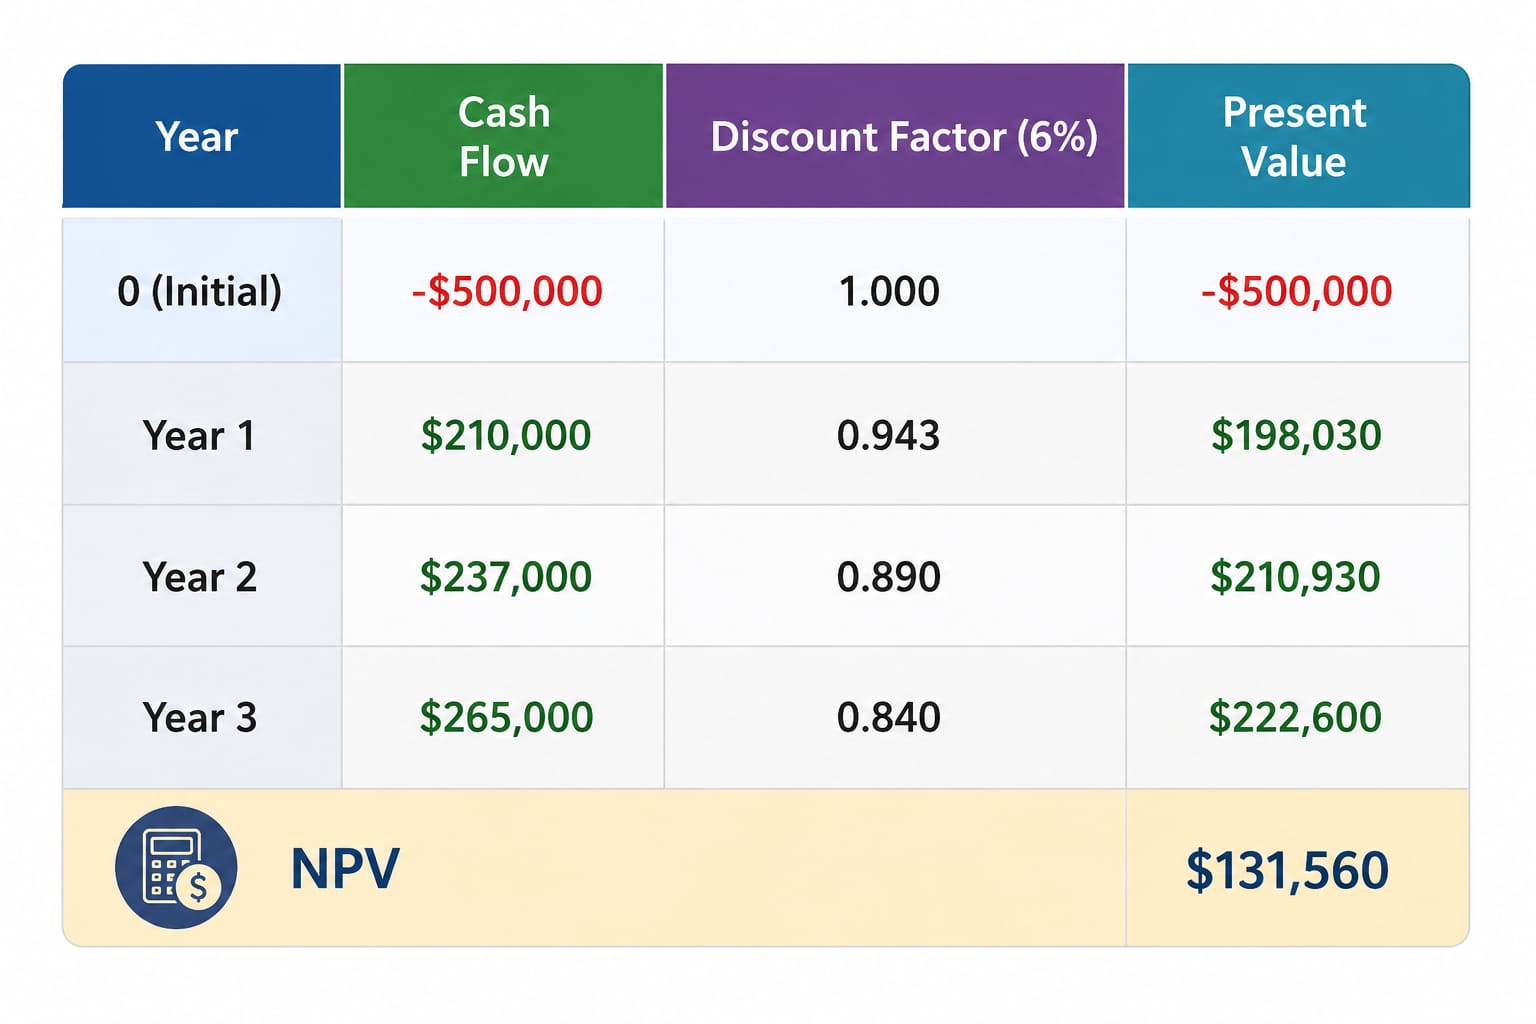
Once you've built your cash flow table listing Year 1, Year 2, and Year 3 entries alongside any additional time series data the real work is learning to read what the numbers are actually telling you. Start by entering your initial outlay, say $500,000 for a machine or a capital investment, then populate each time period: the first time period might return $210,000, the second time period $237,000, and the third time period $265,000 values that aren't identical but reflect realistic production scaling. From there, you calculate by discounting each figure at your chosen rate, such as 6%, back to today that's the core mechanics. What practitioners often skip past is the account-level discipline of labeling inflows correctly: distinguish whether you're working with a single cash inflow or a series of cash inflows, since that changes how the formula aggregates. At $10,000 decisions all the way up to multi-year 3 years horizons involving patents or sale price negotiations, the NPV tool remains consistent; it forces you to commit every expected return to a specific period, removing the vagueness that sinks so many project evaluations before they begin.