
Free Compound Annual Growth Rate (CAGR) Calculator
Introduction
There's a paradox most seasoned investors rarely discuss: a portfolio that swings from 80% gains one year to 60% losses the next can show a 10% arithmetic mean on paper yet you've lost money. This is precisely the gap that CAGR bridges. Rather than averaging raw yearly rate of return figures the way a simple tally would, the compound annual growth rate measures the smoothed rate at which an investment would have grown had it compounded at one fixed annual return across the entire time horizon. It treats all profits reinvested at the end of each year as though that reinvestment happened mechanically, stripping away the volatile yearly fluctuations that otherwise distort perception. In practice, the CAGR works backward from an initial balance and a final balance to derive one clean annual list figure, a standard list figure reliable enough to serve as both a personal benchmark and a disciplined lens for comparing different investments across unequal holding windows.
Where this financial metric proves its real value is not in retrospect, but in forward planning. Say you're evaluating an index fund against equity or bonds each carrying a different specific time period of historical data and erratic year-on-year swings. The average yearly growth rate each instrument appears to deliver through simple totalling is often misleading, because it ignores the compounding effect that makes a lump-sum behave very differently from its face percentage gain. CAGR collapses that complexity into a single rate of return expressed over a period of time longer than one year, giving you a common denominator to weigh performance honestly. It's the reason financial planning professionals reach for this useful metric first: not because it tells you everything, but because it tells you the one thing: a hypothetical value of steady, constant growth rate would look like a disciplined baseline before deeper investment performance analysis begins.
What is the Compound Annual Growth Rate (CAGR)?
The compound annual growth rate isn't merely a formula, it's the financial world's way of cutting through noise. Where simple returns mislead by ignoring compounding, CAGR delivers an annual list rate that reflects how an investment actually behaved across a time period. Think of it as the smoothed, consistent average rate that transforms a starting value into an ending value not in one dramatic leap, but through a compounded rhythm, year over year. Whether you're evaluating equity, mutual funds, or a savings account, this single percentage condenses the entire investment period into one honest, accurate figure. It accounts for the time value of money in a way that arithmetic simply cannot, which is precisely why seasoned investors rely on it over absolute returns when making long-term investment decisions.
What makes CAGR genuinely powerful is how it handles the initial value and final value relationship with mathematical elegance. The CAGR formula uses an exponent specifically 1/n, where n represents the number of years to derive the annual list growth rate between a beginning value and an end value. Unlike raw percentage increase, it doesn't assume linear progress; it computes the geometric mean of growth across multiple time horizons. This is why financial advisors and business professionals treat it as a benchmark: it allows fair comparison across investment options with different time horizons, strips away the distortion of yearly ups and downs, and surfaces true underlying performance. The power of compounding lives inside every CAGR figure, quietly doing what compound interest has always done: turning initial principal into measurable, long-term wealth.
What is Compound Interest?
There's a reason seasoned investors rarely chase simple growth rate metrics they've learned that compound interest operates on a fundamentally different logic. Unlike straightforward returns, compounding works by applying the interest rate not just to your initial balance but to the accumulated ending value at each compounding period. What makes this mechanism so powerful is that your investment doesn't just grow, it grows on its own growth rate, creating a self-reinforcing cycle. The geometric mean captures this behavior more accurately than any arithmetic average annual return, which is precisely why practitioners working in personal finance or portfolio analysis default to compounded annual metrics when evaluating long-term performance across unequal time periods.
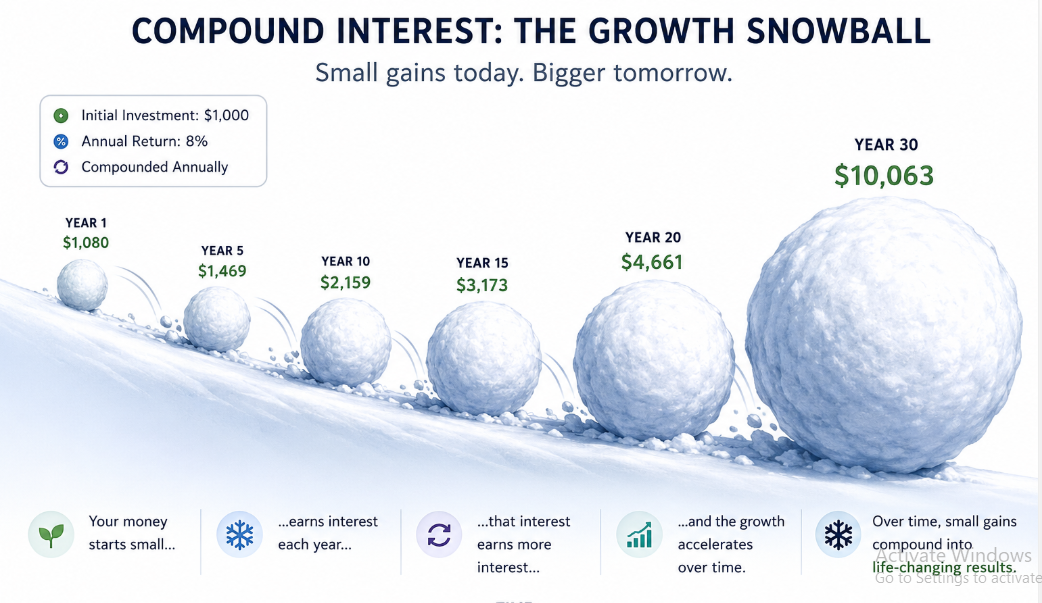
From a practical standpoint, the distinction between compounded returns and flat average rate of return figures becomes starkly visible when you examine investment periods spanning three years or five years. Consider an initial investment of $1,000 that reaches a final value of $1,331 after 3 years the CAGR registers at exactly 10%, while the perceived total growth of 33.1% divided naively across years would mislead any investor into misreading actual profitability. This is the effect of compounding: it does not assume uniform gains but instead applies returns reinvested each year to a progressively larger starting value. In practical cases, this distinction shapes every decision from selecting ELSS funds with a mandatory lock-in period to evaluating economic growth benchmarks against inflation, compounding remains the foundational mechanic behind accurate rate of return assessment.
CAGR Formula
The CAGR formula is built on a precise calculation: you take the ending value, divide it by the starting value, raise the result to the power of 1/3 (or whatever fraction matches your timeframe), then subtract one and multiply by 100. A classic case: a starting value of $1,000 growing to an ending value of $10,000 over 3 years produces 1.1544, which translates to a CAGR percentage of 115.44% the formula compressing years of compounding into a single honest figure. What I find practitioners often overlook is how this same exponent logic applies universally whether you're working with an index fund whose current value sits at 424 versus 376 recorded five years ago, applying 1/5 to 1.22766 at 0.2 resolves to just 2.432% true averaged growth in value across 5 years, stripping away any distortion from year-to-year swings between beginning value and final value.
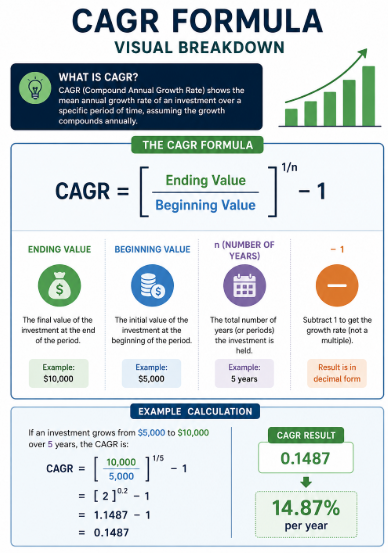
The contrast becomes even sharper when you compare CAGR against arithmetic average annual return take $1,000 reaching $1,300 between May 2015 and May 2018: the CAGR lands at 9.14%, not the misleading raw 30% total, because the formula tracks Year 1 at $1,091.40, Year 2 at $1,191.15, and Year 3 back to $1,300, compounding at 10.00% with a decimal of 0.0914. The same discipline applies to rupee-denominated scenarios Rs 1,000 growing to Rs 1,500 over a five-year period reflects 8.45% per year, a figure your calculator produces only when inputs correctly feed the compound annual growth rate engine. Even Rs 1,000 to Rs 1,331 across three years proves the point: despite an arithmetic average annual return of 11.03%, the real CAGR is exactly 10% because Rs 1,100 in Year 1, Rs 1,210 in Year 2, and Rs 1,331 in Year 3 compound annually at a steady rate, never inflating to 14.87% or any other distorted figure the averaging method might suggest.
How to Calculate CAGR Step-by-Step
Breaking down the CAGR formula starts with identifying three core variables: the ending value (EV), the starting value (SV), and the investment time horizon (t) measured in years.
Mathematical Expression:
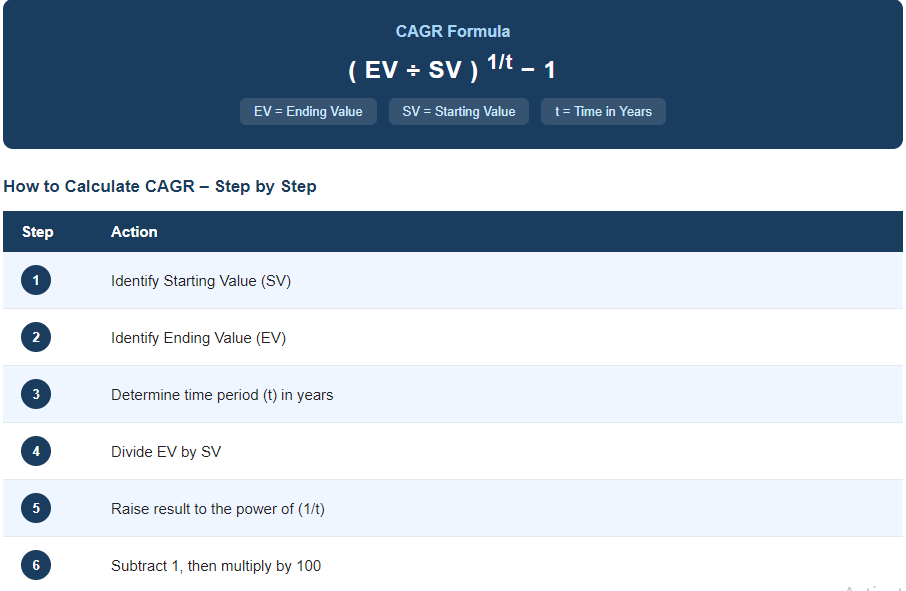
Walk through it concretely: if your starting value was ₹10,000 and your ending value reached ₹17,000 over 5 years (17000/10000)^(1/5) yields roughly 1.1117 subtract 1, multiply by 100, and your CAGR percentage lands near 11.17%.
How to Calculate CAGR Examples
Example 1:
Mutual Fund Growth Over 5 Years
Example 2:
Comparing Two Companies Over a 3 Year Window
A 3 year CAGR comparison is one of the sharper ways to compare performance between two companies rather than relying on headline revenue numbers. On raw numbers, A looks dominant. On a time-based comparison, B is actually the stronger performer. This is precisely why CAGR functions as a key metric for equity comparison rather than absolute figures.
Example 3:
Tracking a SIP Portfolio Against Inflation
If inflation ran at 6% across the same time horizon, your real return clears it comfortably. That gap is what separates a portfolio doing real work from one merely keeping pace.
Example 4:
Using the Reverse CAGR Formula for Goal Setting
Here's an angle that doesn't get enough attention: working inversely. You know the future value you want, say ₹50,00,000 and you know your starting value (₹15,00,000) and investment tenure (8 years). This kind of inverse calculation is central to serious financial planning, not just checking past historic returns.
Example 5:
Evaluating Stocks Against Risk Free Instruments
The difference isn't just numerical, it reflects the risk taken for that premium. Framing it through annual list figures rather than total growth percentage alone makes fair comparison possible.
Difference Between Simple Growth Rate and CAGR
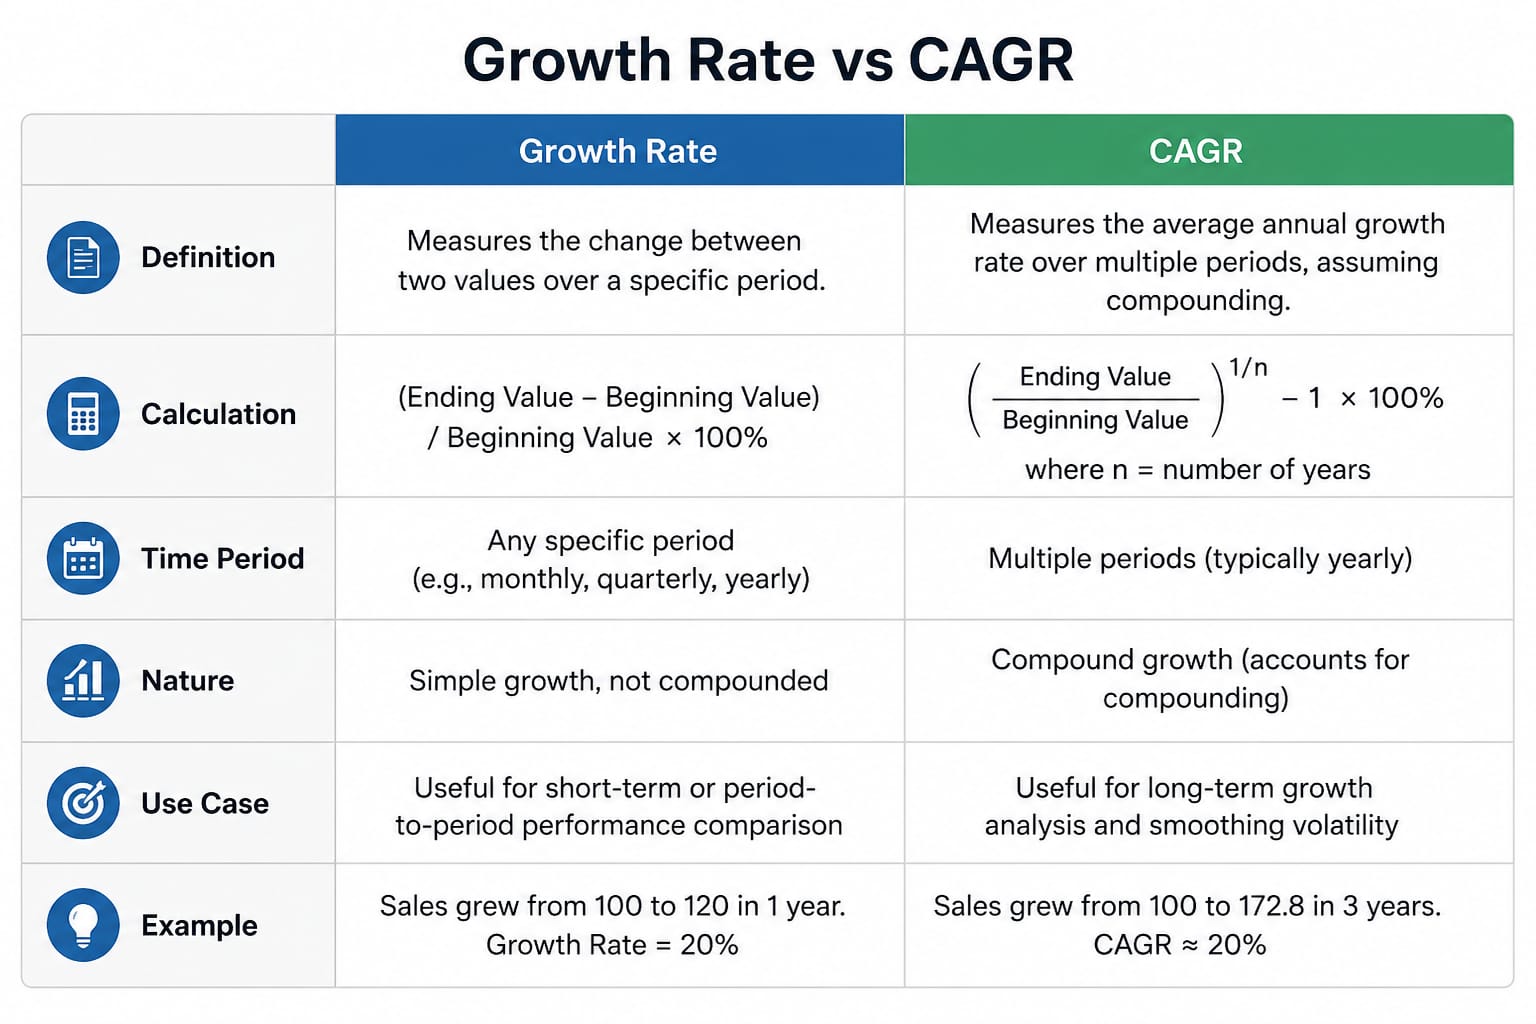
The average annual growth rate and CAGR are not interchangeable, even though both claim to describe investment progress over time. The average annual growth rate and CAGR are not interchangeable, even though both claim to describe investment progress over time.
Where CAGR Is Used
CAGR cuts through the noise of rises and falls in investment data by offering a single annual list growth rate that lets analysts make easy comparisons across different portfolios. Key use cases include:
Limitations of CAGR
What CAGR quietly conceals is more instructive than what it reveals.
By design, this metric smooths everything into a single clean figure and that polish is precisely where distortion lives. A more complete picture demands layering historical data, examining rate of return volatility, and treating CAGR as one input in a compounded picture rather than the final verdict.
Calculating CAGR in Excel
Excel doesn't have a built-in CAGR function but that gap is what makes it powerful. You're forced to understand the formula rather than blindly trusting a black box.
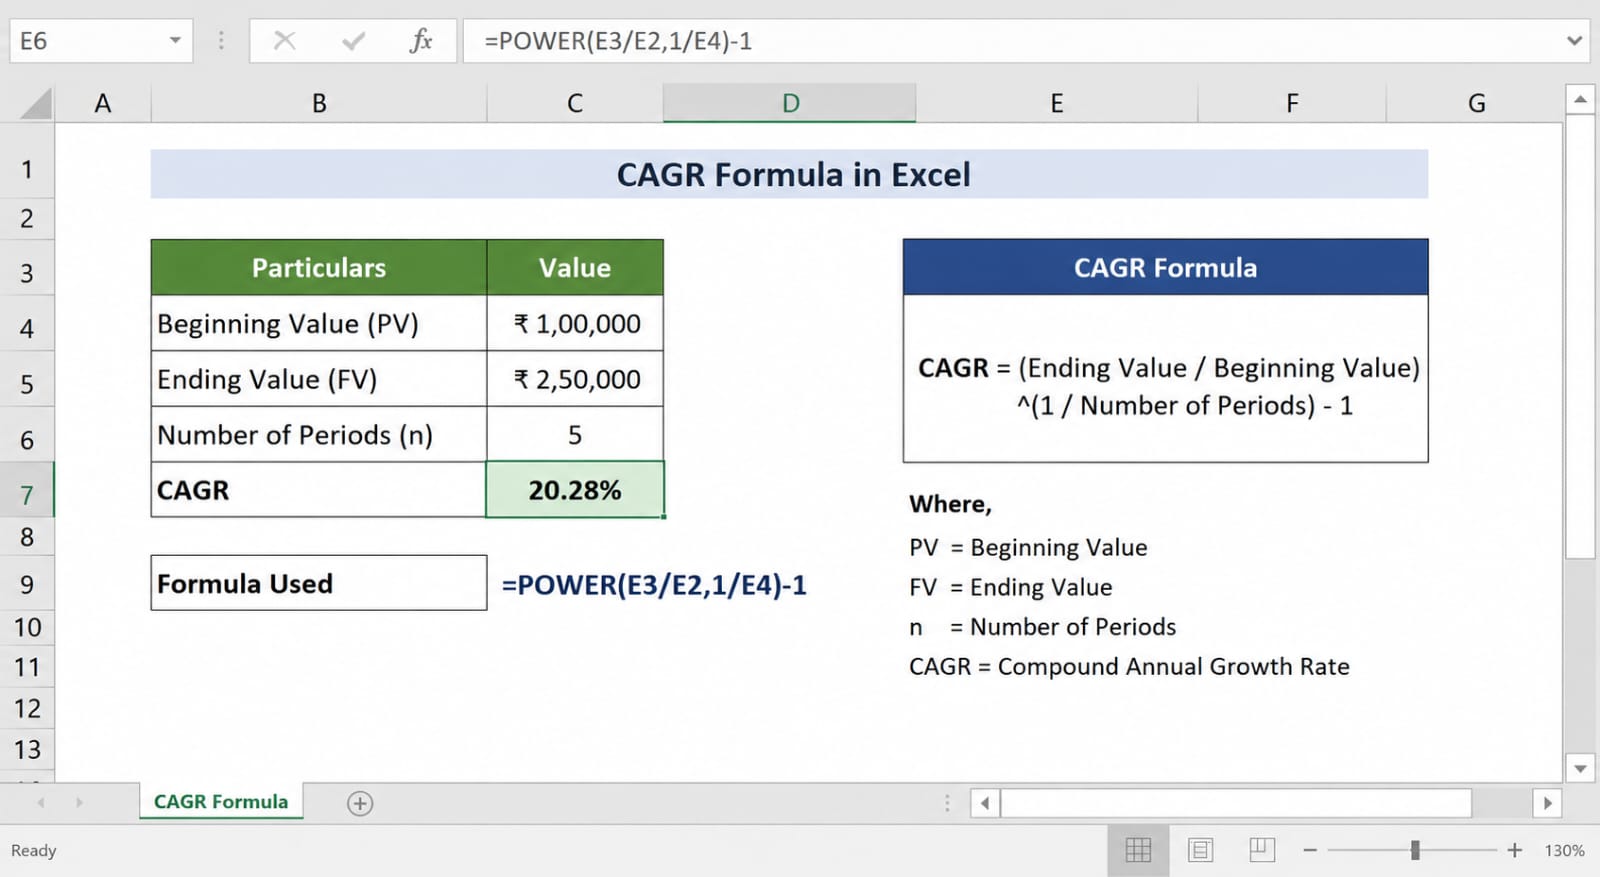
Important:
Format cell B4 as Percentage for a clean readable output. Locking cell references matters enormously one relative reference error in the duration cell and your entire portfolio evaluation falls apart.
Reverse CAGR Calculator
Working backwards through a growth rate problem is where investment scenarios become genuinely actionable. The Reverse CAGR Calculator flips the conventional logic: instead of feeding in a starting value and final value to discover a CAGR, you start from a target outcome and ask what starting value was required to reach it.
This transforms financial planning from a passive estimate exercise into a precise, forward committed decision one where compounded yearly logic serves intention rather than merely measuring history.
About the CAGR Calculator
Anyone serious about financial planning knows that a reliable useful tool can change how you estimate and track investment growth over any selected period. This application lets you calculate returns with genuine accuracy you simply feed in your Initial Investment, Final Investment, and the time frame, and the calculator handles the rest. Whether you're mapping out a business trajectory or reviewing how a personal portfolio has moved, having a clean average rate to anchor your thinking matters more than most people admit. I've personally found that skipping this step leads to decisions made on gut feeling rather than grounded numbers.
What makes it work is how it processes user inputs across any time period down to the number of months if you need that granularity. The gain you see at the end isn't a rough approximation; it reflects a precise measurement across the selected period you define. Whether you're comparing short windows or multi-decade horizons, the calculator surfaces what truly happened to your money over time: no guesswork, no rounding errors dressed up as insight.