
Internal Rate of Return (IRR) Calculator
Introduction
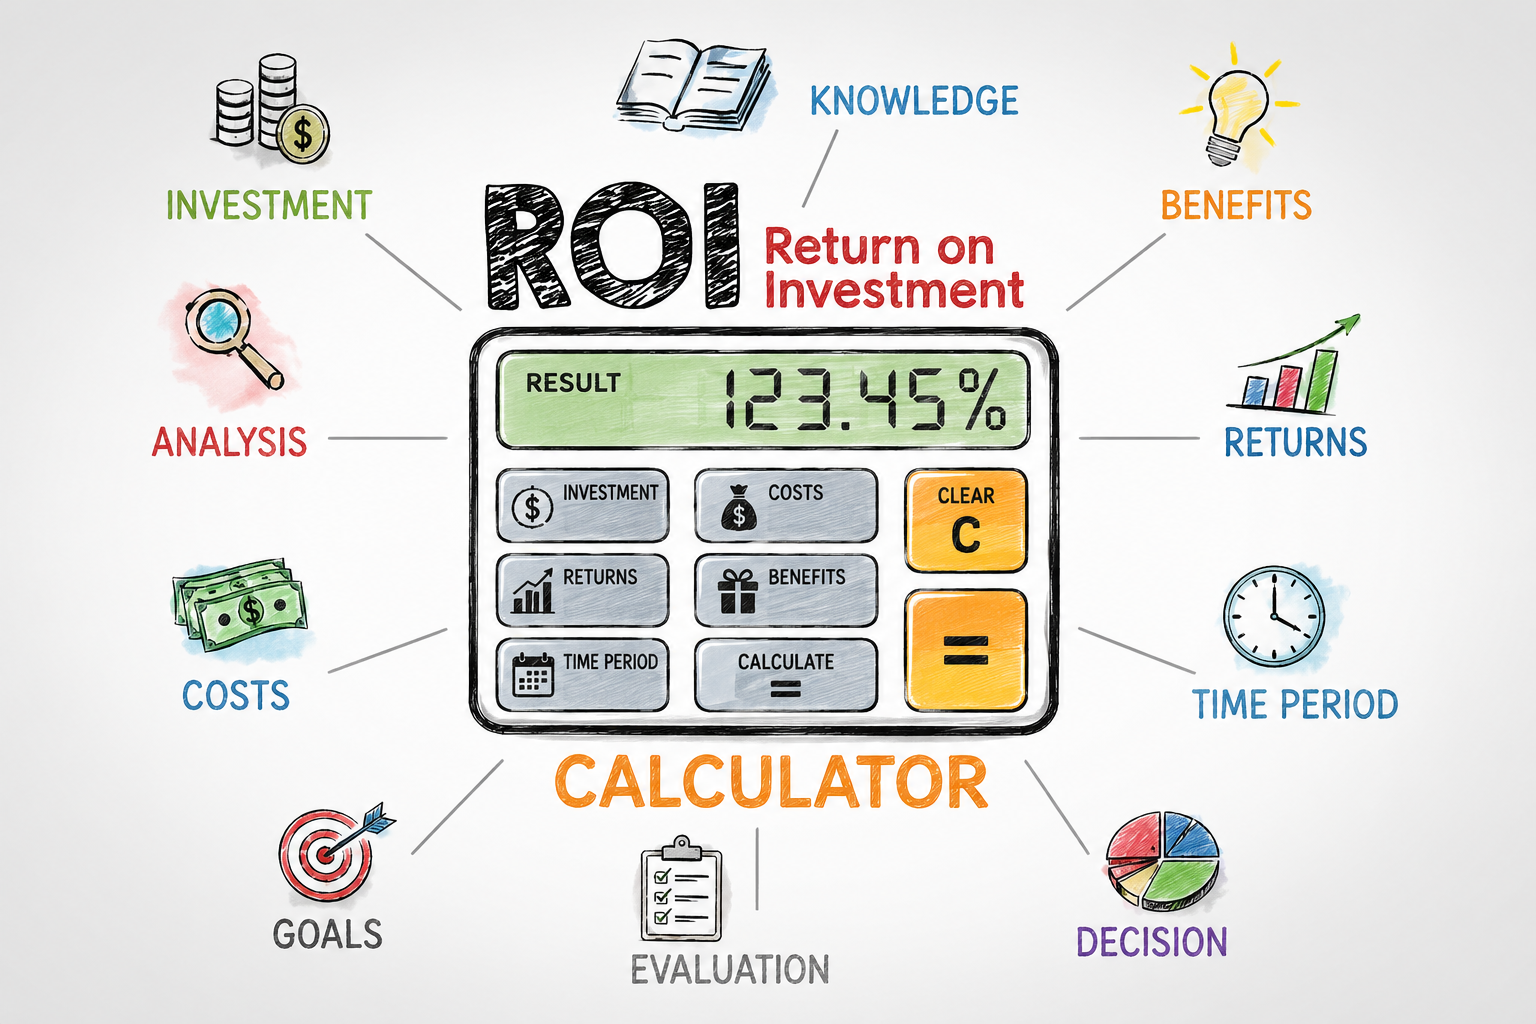
Finance rarely rewards hesitation and that's precisely where ROI, or return on investment, earns its reputation as the most widespread metric practitioners keep returning to. At its core, this ratio captures a deceptively simple truth: divide net gain by net cost, multiply by 100, and you hold a percentage that translates complex investment outcomes into a single, scannable number. What makes this cash flow measure genuinely powerful isn't sophistication it's the brutal clarity it forces. Whether you're weighing real estate, a stock market position, or an internal marketing program, the formula doesn't negotiate. It returns either a positive ROI, confirming something profitable was built, or a negative ROI, signaling that value fell below its initial value and no amount of narrative rewrites that verdict.
What experienced investors understand, though, is that the calculation is only as honest as the inputs feeding it. Easily available data makes the metric feel approachable, but simplicity can mask distortions particularly when time, risk, and economic consequences aren't factored into the frame. Tools like NPV, IRR, and payback period exist precisely because a single ROI figure, stripped of investment duration context, can mislead. A 10% return read as 0.1 sounds modest until you realize it arrived in three months, not a decade. This is why seasoned decision-makers rarely lean on ROI in isolation; they treat it as a starting point, an auxiliary signal that earns its place alongside deeper profitability and financial analysis. The percentage points matter, but so does understanding what surrounds them.
Return On Investment Calculator Formula
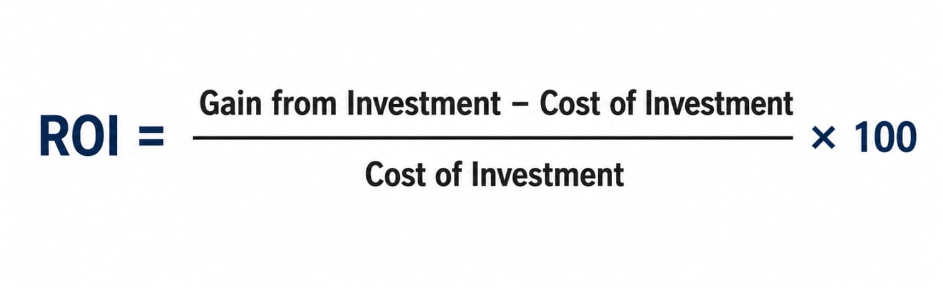
The formula behind return on investment rarely gets the philosophical scrutiny it deserves; practitioners treat it as arithmetic, yet it functions more like a decision filter. At its core, two figures drive everything: gain from investment and cost of investment.
That clean output, whether it signals profit or loss, is why financial analysts, businessmen, and even first-time investors scribble this on a napkin before committing capital. Its simplicity is not a weakness; it is exactly what makes it a quick-and-dirty method that holds up across stocks, real estate, and even unconventional plays like a sheep farm. I've seen seasoned professionals rely on it at the initial stage of an investment project precisely because it strips away noise and forces a rational conversation about whether the net investment benefit justifies moving forward.
What complicates the ROI formula in professional application is the variability in defining cost. Consider investor A versus investor B evaluating the same stock one folds in taxes on capital gains, capital expenditure, and insurance, while the other uses only purchase price.
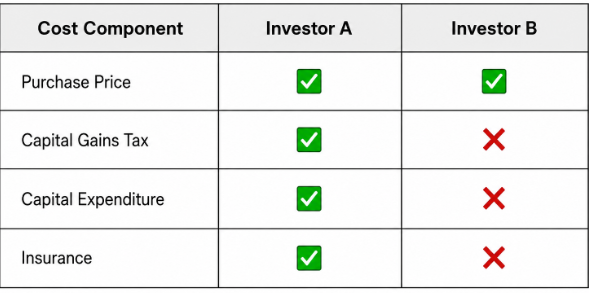
The results diverge, not because the math is flawed, but because the inputs aren't standardized. This is why the ROI formula functions best when paired with a clearly defined base and a consistent timeframe without those anchors, the same metric can produce a bias that leads to improper decisions.
Examples of ROI Calculation
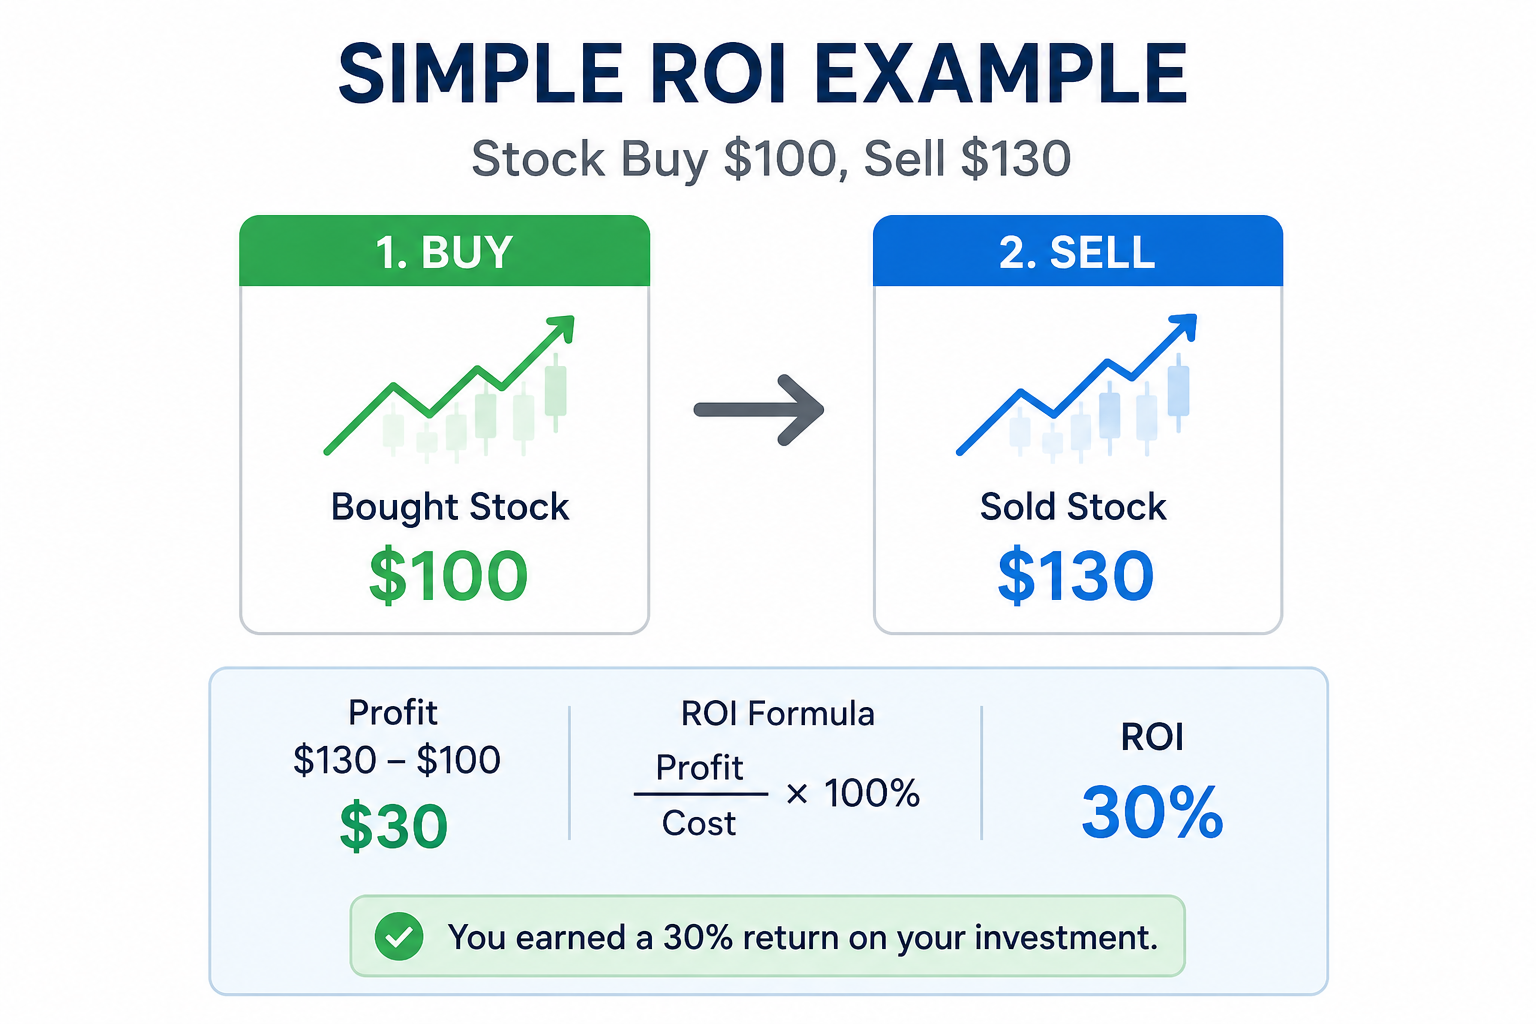
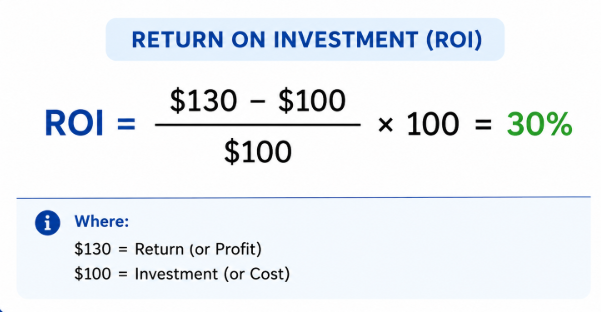
When evaluating a straightforward investment, the ROI formula becomes your first line of clarity. Say you purchase a stock for $100 and later sell it at $130 the net gain sits at $30, and dividing that by your initial investment yields a clean ROI of 30%.
But here's what most practitioners overlook: that result only tells half the story. The investment of time matters enormously. A 30% return over one month is radically different from the same percentage stretched across four years. This is precisely where annualized ROI steps in converting raw rate of return figures into a standardized, comparable metric.
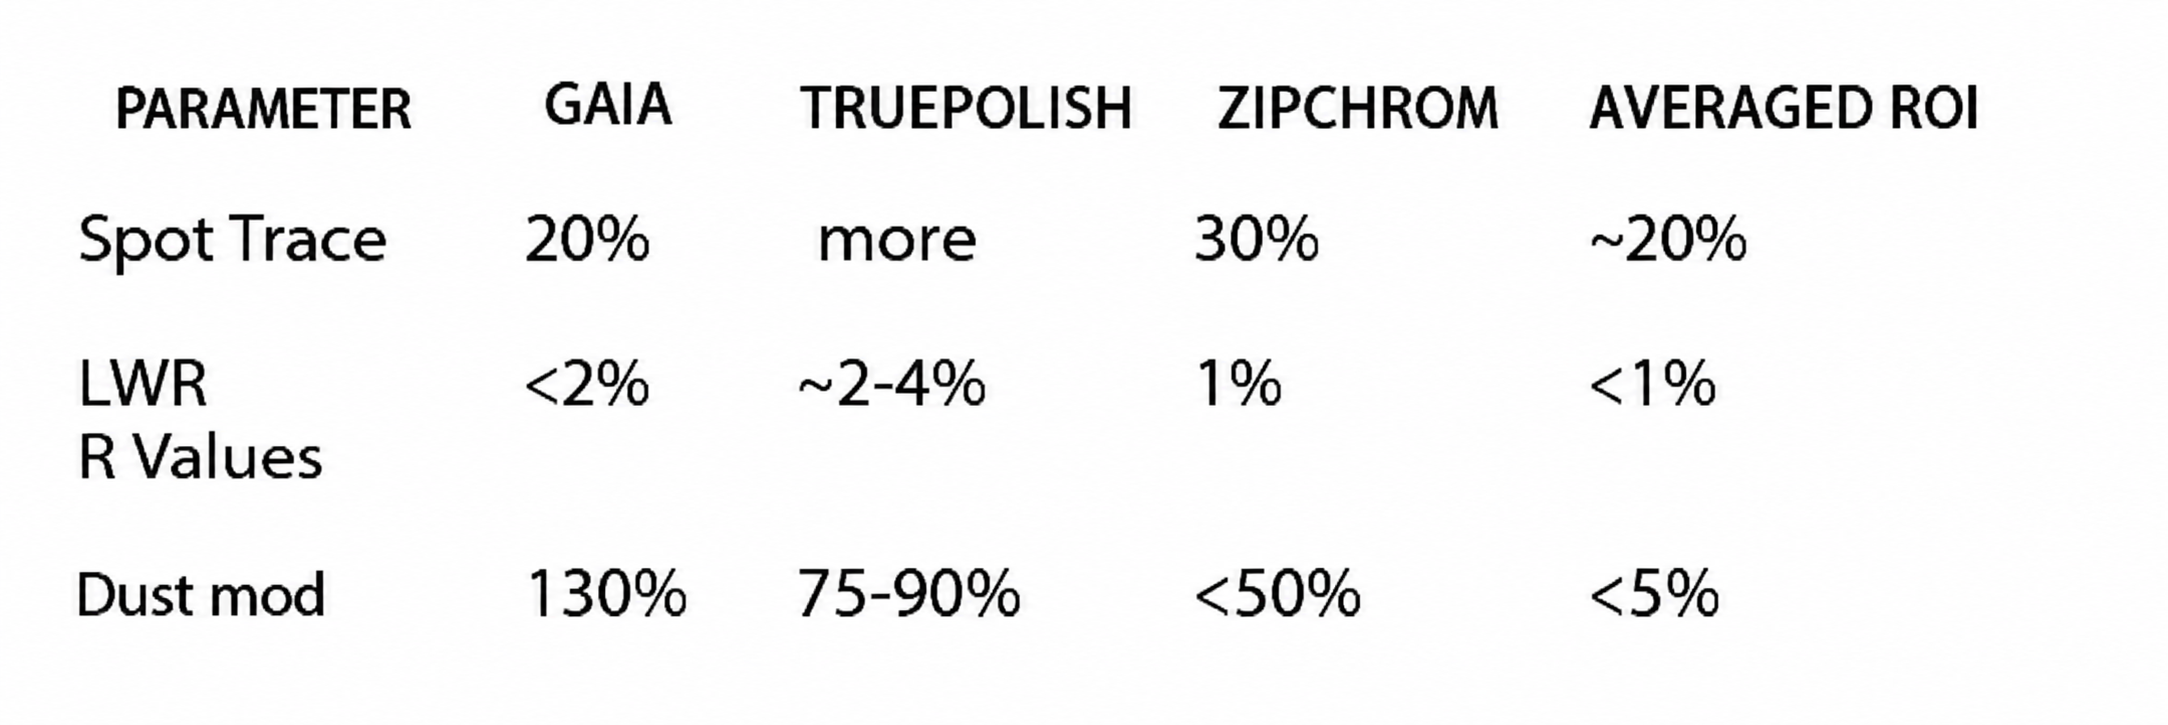
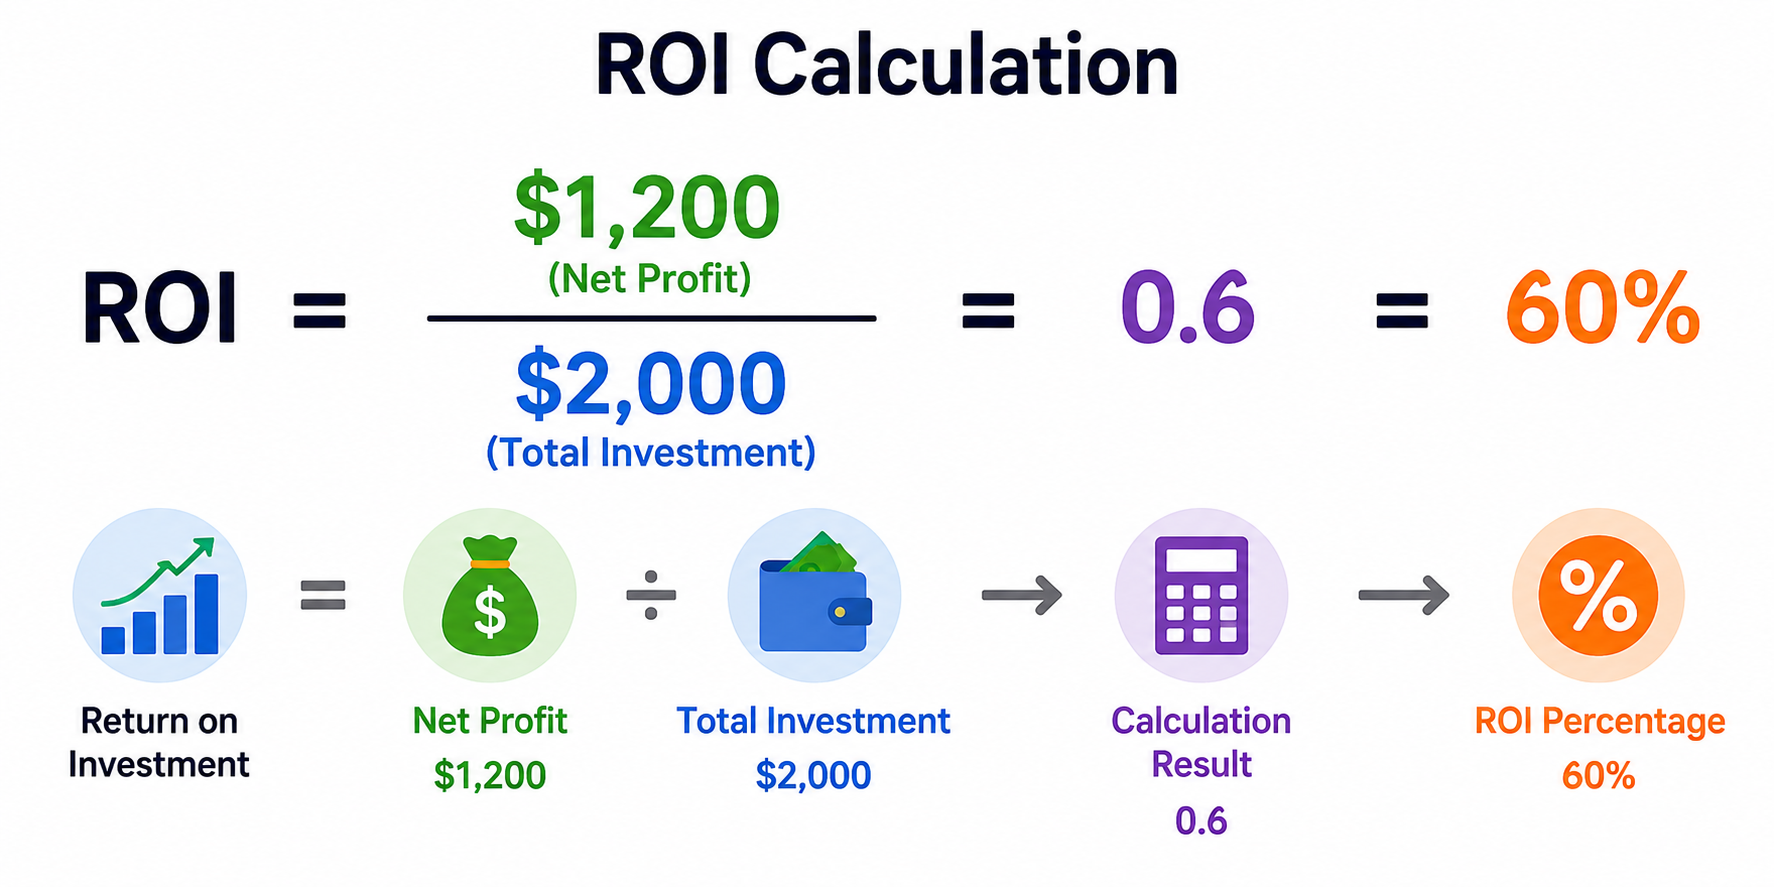
Zooming into more complex territory, consider how net profit and total investment interact across different asset classes.
Experienced investors weigh investment risk alongside raw returns, recognizing that a higher annualized ROI paired with extreme volatility doesn't always outperform a lower risk option delivering steady compound interest.
Annualized ROI
Most practitioners overlook a quiet but critical flaw in their reporting: they compare a stock that gained 20.21% over nine months against a real estate deal returning 50% across three years and call the second one better. Without annualized ROI, that comparison is noise.
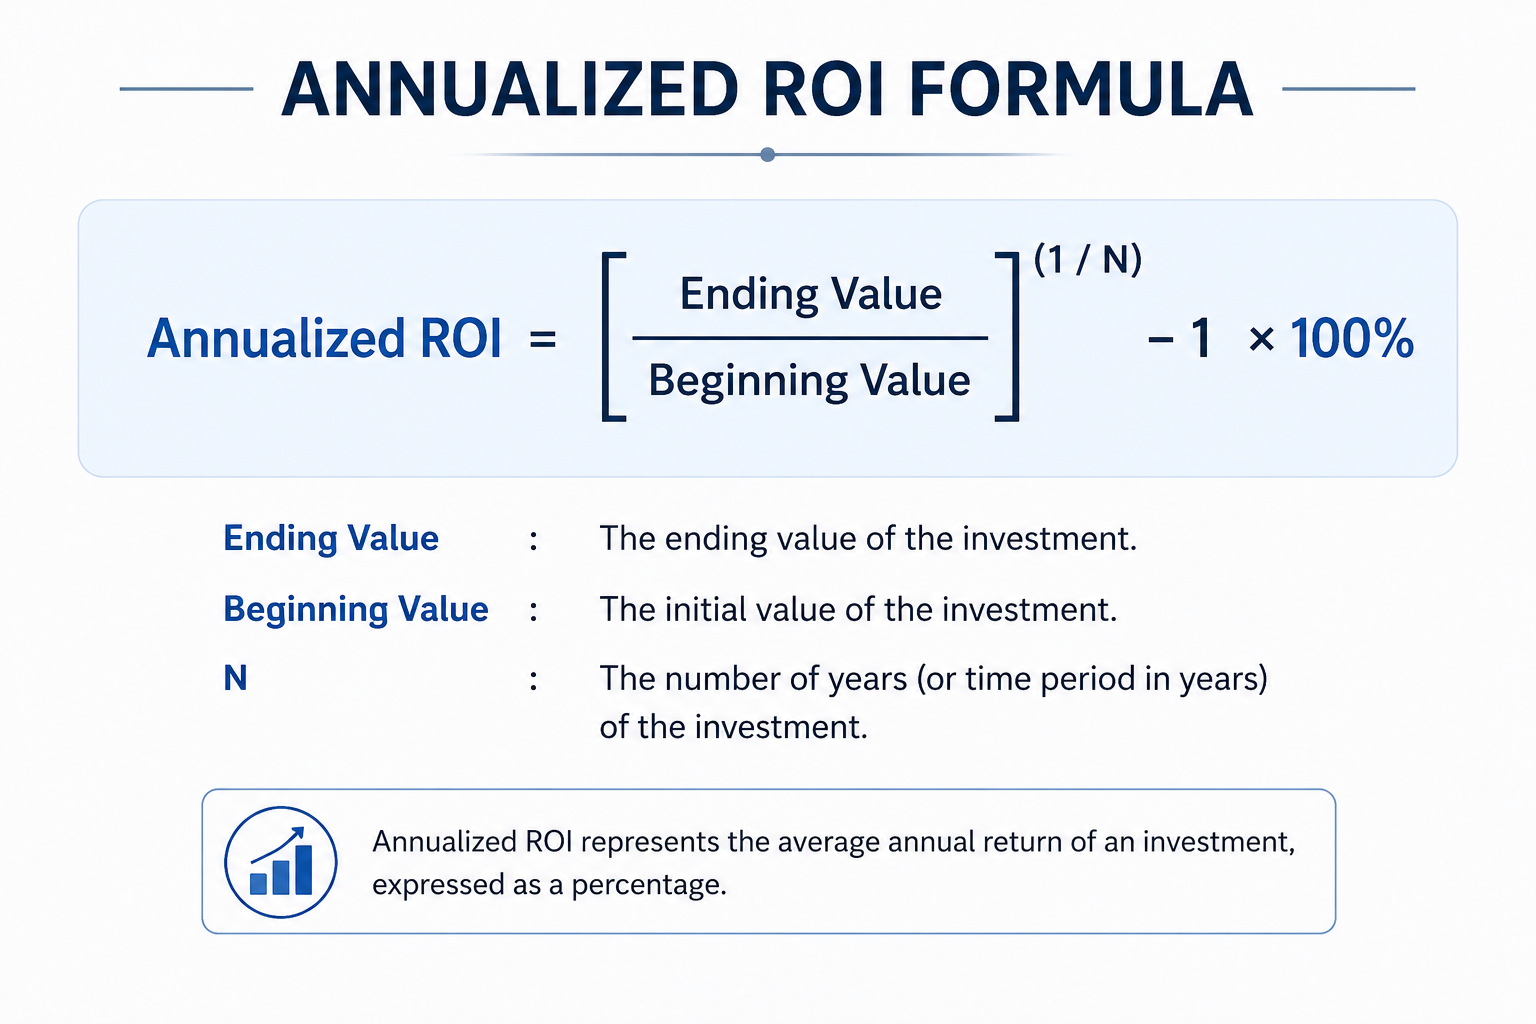
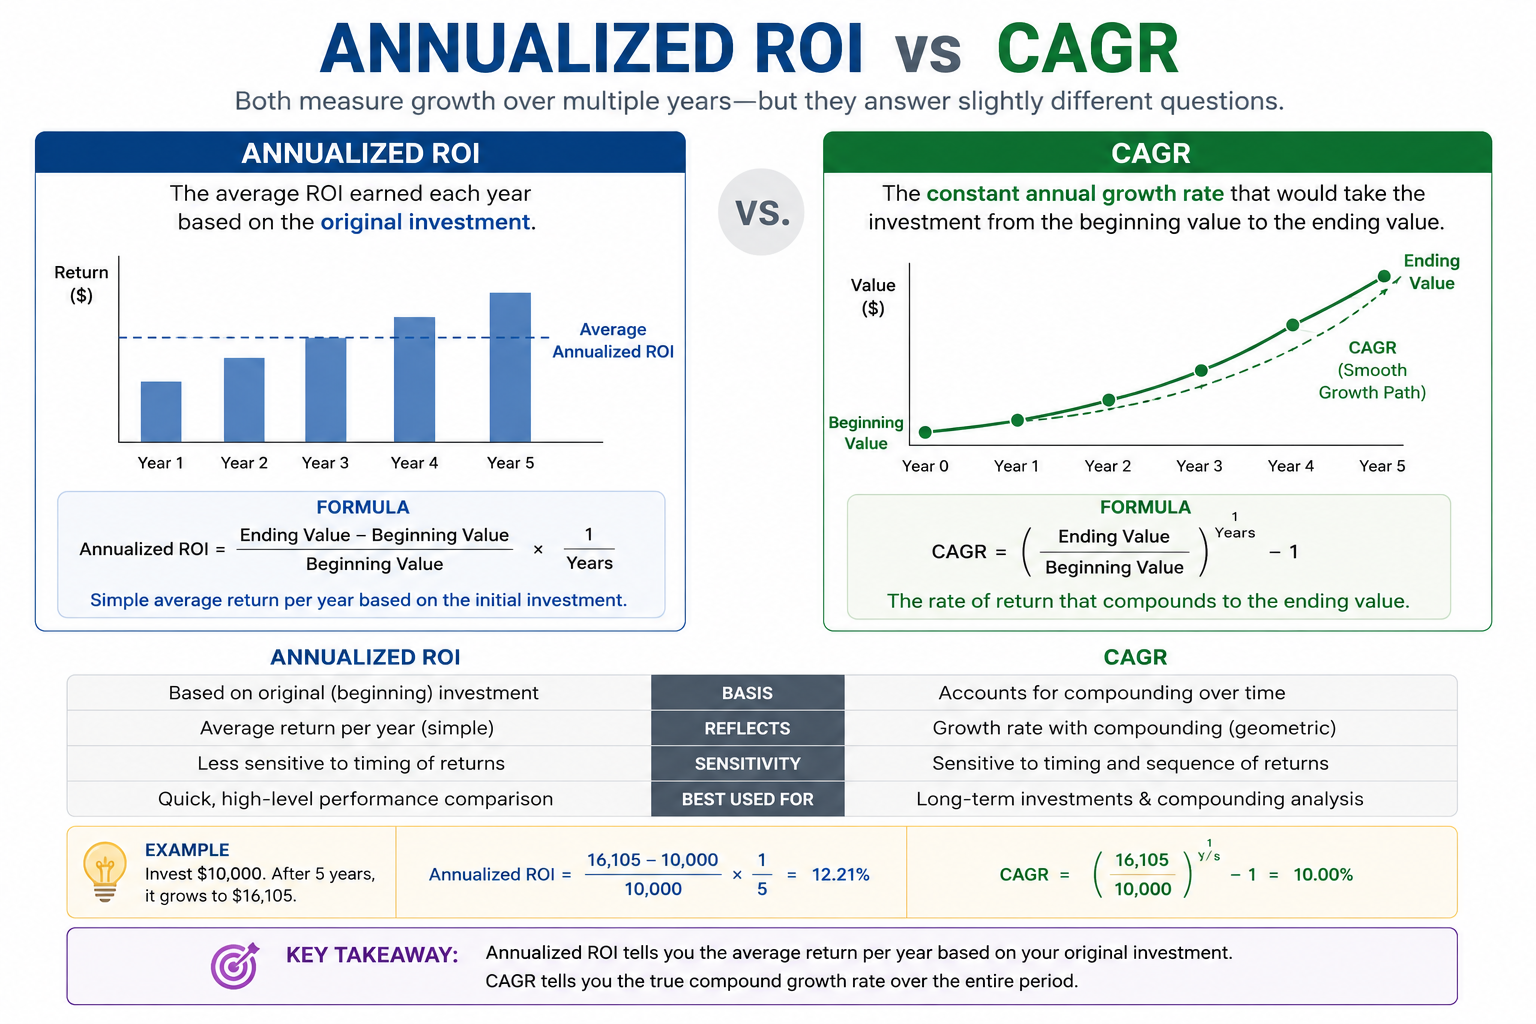
What annualized ROI actually does is normalize those returns against a consistent yearly growth rate baseline giving every investment an honest lane to race in. It is not the same as CAGR, which tracks total growth assuming profits reinvested at a fixed rate; annualized ROI is sharper, trimming the timeline fat to expose useful, per-year performance without assuming reinvestment mechanics
What makes ROI genuinely powerful for financial decisions is its broad usage across dissimilar asset classes. You can compare whether a $250,000 operational budget reallocated toward digital infrastructure generates better profits than an equivalent spend on physical expansion, all within the same objective framework.
ROE vs. ROI
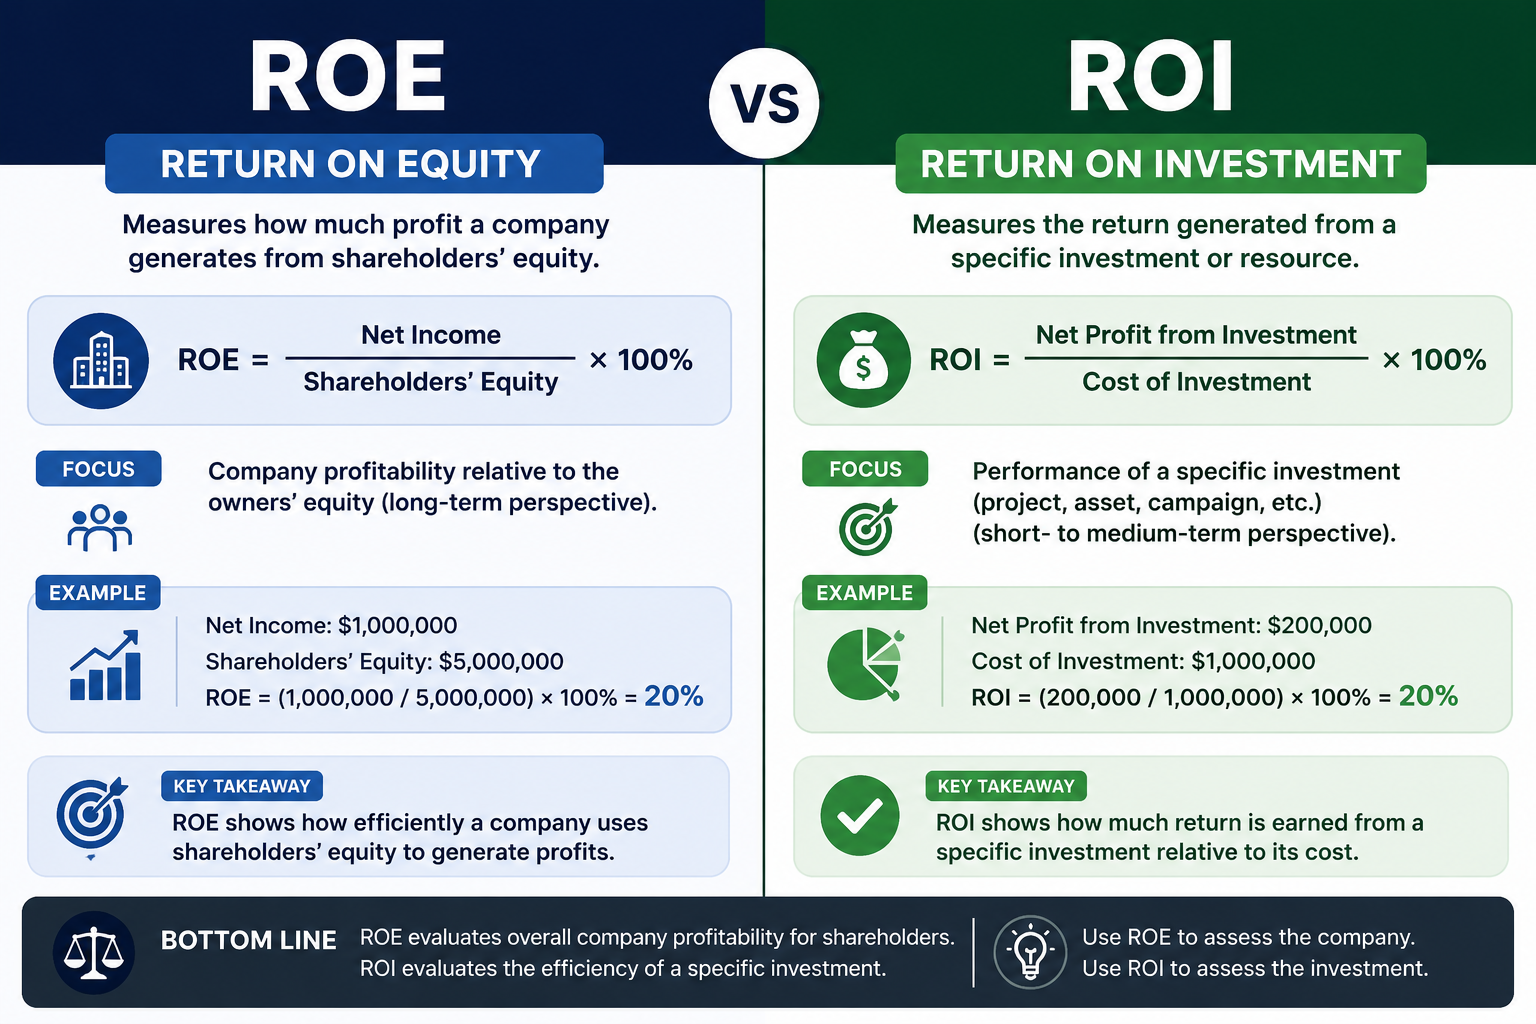
Return on Equity and Return on Investment share a surface-level resemblance both signal efficiency yet practitioners who conflate them tend to miss critical opportunities hiding in plain sight.
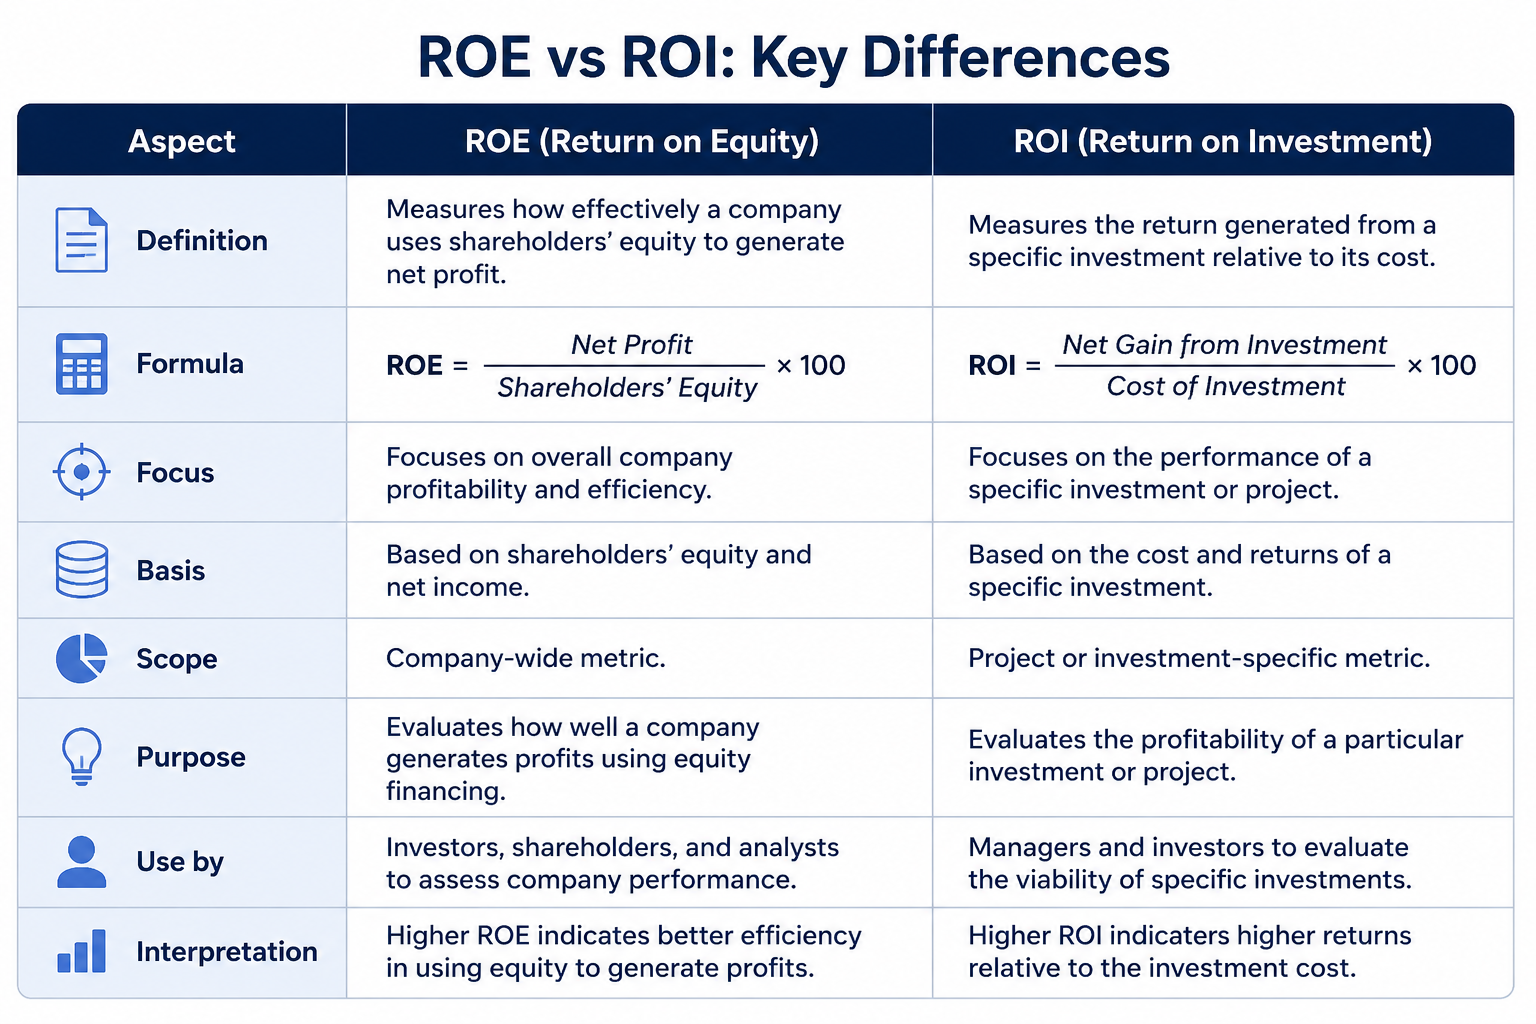
Neither metric is complete without the other, and neither escapes the shared limitations of accrual accounting. The weakness both ratios share is their reliance on reported figures which is precisely why pairing them with cash-flow measures remains the more defensible analytical habit.
Difficulty in Usage
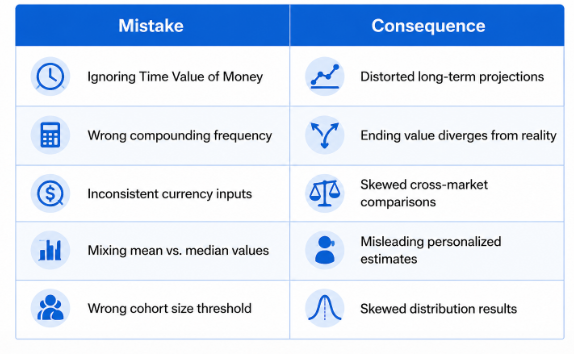
Complicated as it may seem at first glance, the real friction with an ROI calculator rarely lives in the formula itself it surfaces in what you feed it. From misidentifying total expenditure to conflating compounded interest return with simple after-tax return, practitioners routinely wrestle with inputs that carry hidden variables.
Advantages and Disadvantages of ROI
From a practitioner's standpoint, ROI's real strength lies in its universal applicability across virtually every branch of industry whether you're in Construction, Education, Health Services, Leisure, Hospitality, Trade, Transportation, or Utilities. Unlike complex single-period methods, it delivers absolute clarity on investment profitability without demanding deep financial expertise. A well-structured ROI calculator drives operating efficiency by exposing unprofitable allocations early especially when you stack it against EBITDA margin, EPS, or CAGR benchmarks and when ROI ≥ 0, it becomes an actionable compass for diversification across a portfolio. Integrating marketing metrics, deal size amount, and average revenue per closed deal transforms it into a complete decision engine, capable of capturing revenue change, marketing leads change, and website visitors change in real time. Sophisticated investors layer in stock options, calls, puts, and bull call spread strategies to sustain extra profit while maintaining limited risk effectively boosting higher ROIs and extra income even during drawdowns. When paired with a CAGR calculator or profit margin calculator, the tool moves beyond a snapshot into a growing, positive narrative about compounded returns over 10 years or beyond extending all the way back to January 1 1970 when the S&P 500 delivered 10.3% with reinvestment of dividends.
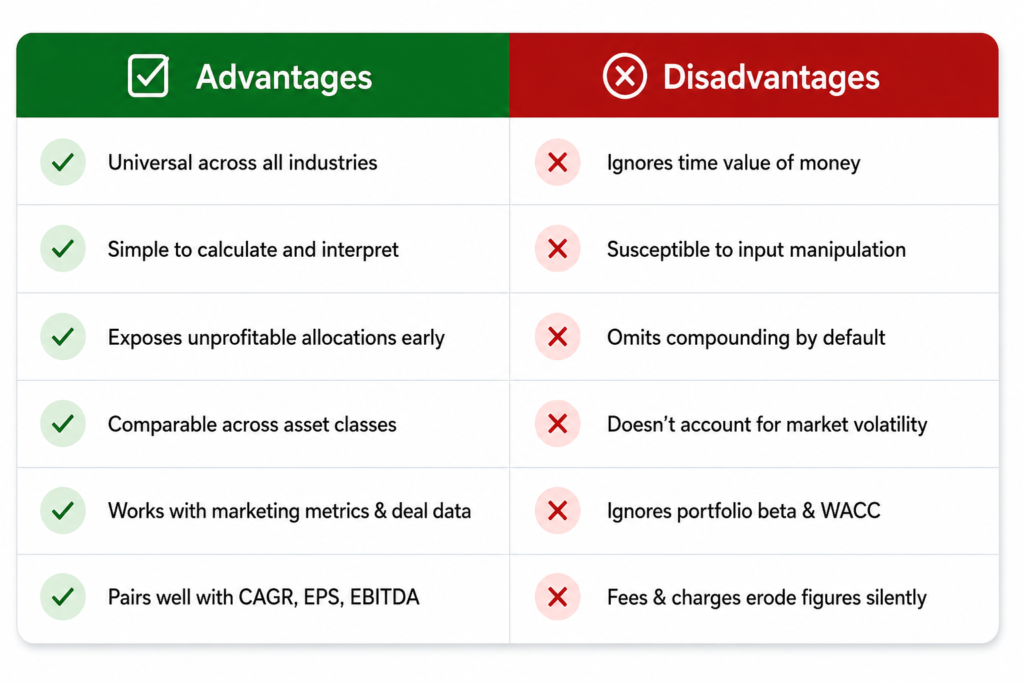
Yet ROI's very simplicity is where its limitations surface and experienced analysts know it can be difficult to rely on as a supplement-free metric. It struggles to account for broad market volatility, portfolio beta, or the weighted average cost of capital that ultimately determines whether a limit value (LV) is being met. The formula using variables G, C, and n omits compounding, accumulated interest, and periodic growth dynamics unless deliberately engineered into the model; consider that savings accounts at just 0.25% versus the highest 12-month return of 61% (from June 1982 to June 1983) or the lowest 12-month return of -43% (from March 2008 to March 2009) represent a chasm the basic formula barely captures. Fees, sales charges, and Separate Account costs quietly erode principal balances, while additional investments made at the beginning of each period complicate the total invested capital figure. The metric also ignores ROE (return on equity), own capital versus debt ratios, and the characteristic feature of compounded returns across one hundred scenarios that sophisticated indicators demand. Even platforms like Marketing Hub with annual license, onboarding, and total cost of ownership considerations, plus Breeze AI capabilities remind us that the usefulness of any software tool depends on pairing ROI with hurdle rates, ROI comparisons, and investment alternative evaluations to avoid treating a surplus as unconditional validation. The build vs. buy calculator and average yearly gain tools exist precisely because ROI < 0 doesn't always disqualify an option when tailored industry customer benchmarks from +237% down to +91% and +175% provide the corrective aggregated data context that raw ROI figures alone never will.
Investing Recommendations for Better ROI
When seasoned investors reflect on historical performance benchmarks like the S&P 500 or Standard & Poor's 500, the data tells a compelling story: the 10.3% average annual return since January 1 1970 wasn't accidental. It was built on disciplined reinvestment of dividends, consistent additional investments, and a clear understanding that principal balances erode silently when fees and sales charges go unchecked. I've personally seen portfolios underperform not because of poor purchase decisions, but because investors ignored the total cost of ownership buried inside Separate Account structures and investment funds. The difference between a targeted estimate and your investment final total often comes down to whether you accounted for every calculation layer from accumulated interest to what those gains actually mean in today's dollars.
What most practitioners won't tell you is that chasing the highest 12-month return of 61% recorded between June 1982 and June 1983 is far less instructive than studying the lowest 12-month return of -43% between March 2008 and March 2009 because individual results, markets, and your customer base geography all shape real performance outcomes. Comparing savings accounts yielding a flat 0.25% against a structured Separate Account with reinvested principal reveals how financial institution choices directly impact total invested capital over 10 years. Smart recommendations also account for monthly averages, website traffic of investment platforms, form submissions for fund allocations, and even stage-based factors tied to purchasing cycles. Whether you're working with Starter, Professional, or Enterprise-level workflows, aligning your inputs with complete values ensures that by December 31st 2016 benchmarks or beyond, your ROI trajectory stays globally competitive; nothing is ever guaranteed, but disciplined strategy brings you closest to it.
Marketing ROI Calculator
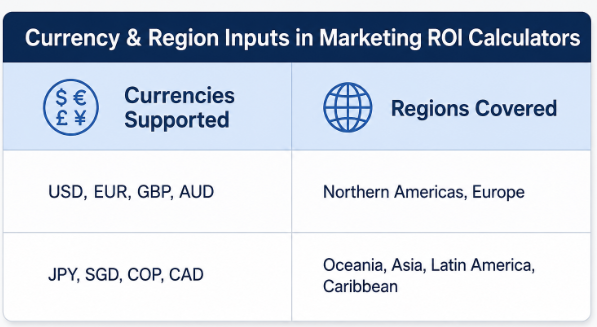
At its core, a Marketing ROI Calculator is a precision instrument one that measures how effectively your money moves through a campaign and returns something tangible. Unlike vague performance dashboards, this tool forces a direct confrontation with numbers: what you spent, what you earned, and whether the gap between those two points justifies continued investment. Having worked across industries ranging from Construction and Education to Health Services, Leisure, and Hospitality, the practical reality is that no two sectors interpret "return" identically. A Transportation firm weighing fleet acquisition against lead generation behaves nothing like a Utilities provider calculating subscriber retention value yet both rely on the same definitional backbone this calculator provides. The aggregated data feeding into these computations draws from HubSpot CRM activity, and when results show figures like +237%, +175%, or even a modest +91%, those percentages aren't abstract they represent real closed pipelines across Trade, education campaigns, and hospitality launches tracked between January 2019 and December 2025.
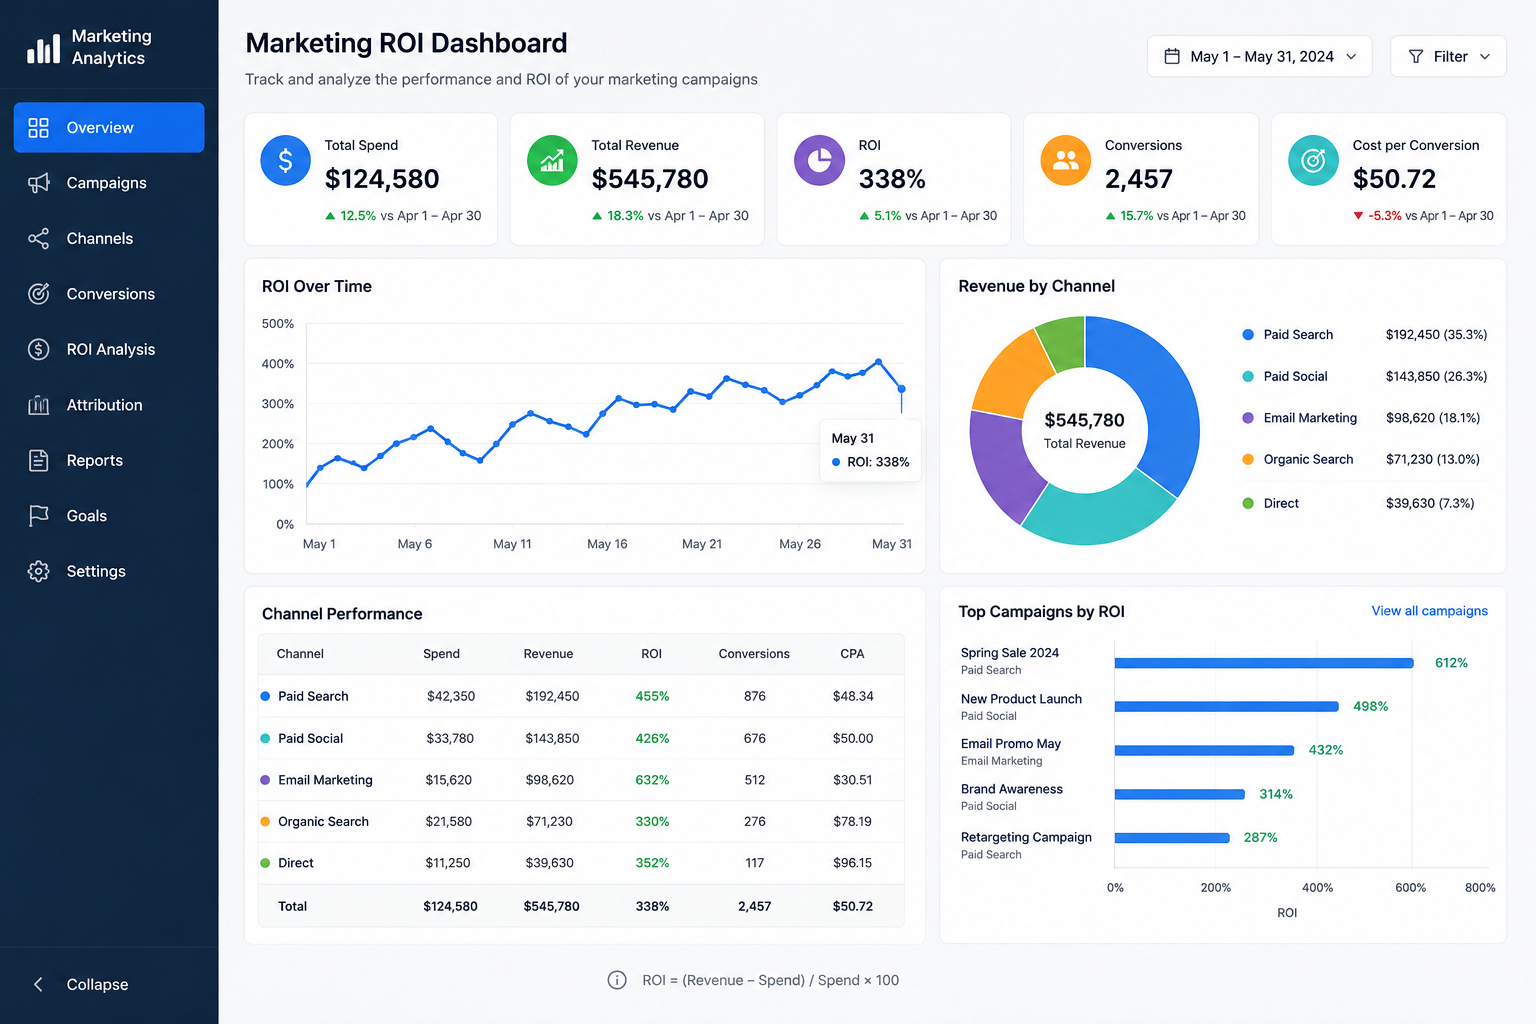
What makes this calculator functionally distinct from a spreadsheet guess is its integration with Marketing Hub, where Breeze AI processes behavioral signals, web forms, service interactions, and product features to refine inputs continuously. The annual license structure and onboarding framework ensure that users aren't simply handed a formula they're trained to interpret it. The tool's applications extend beyond a single campaign snapshot; cohort comparisons, metric baselines, and global value thresholds are all embedded into its logic. Definitions here aren't static; they account for outliers, apply statistical techniques, and factor in average improvement windows spanning the first month through three months post-activation, giving practitioners a genuinely operational understanding of what the numbers mean before a single closed sale is ever recorded.
Additional Information and Further Calculators
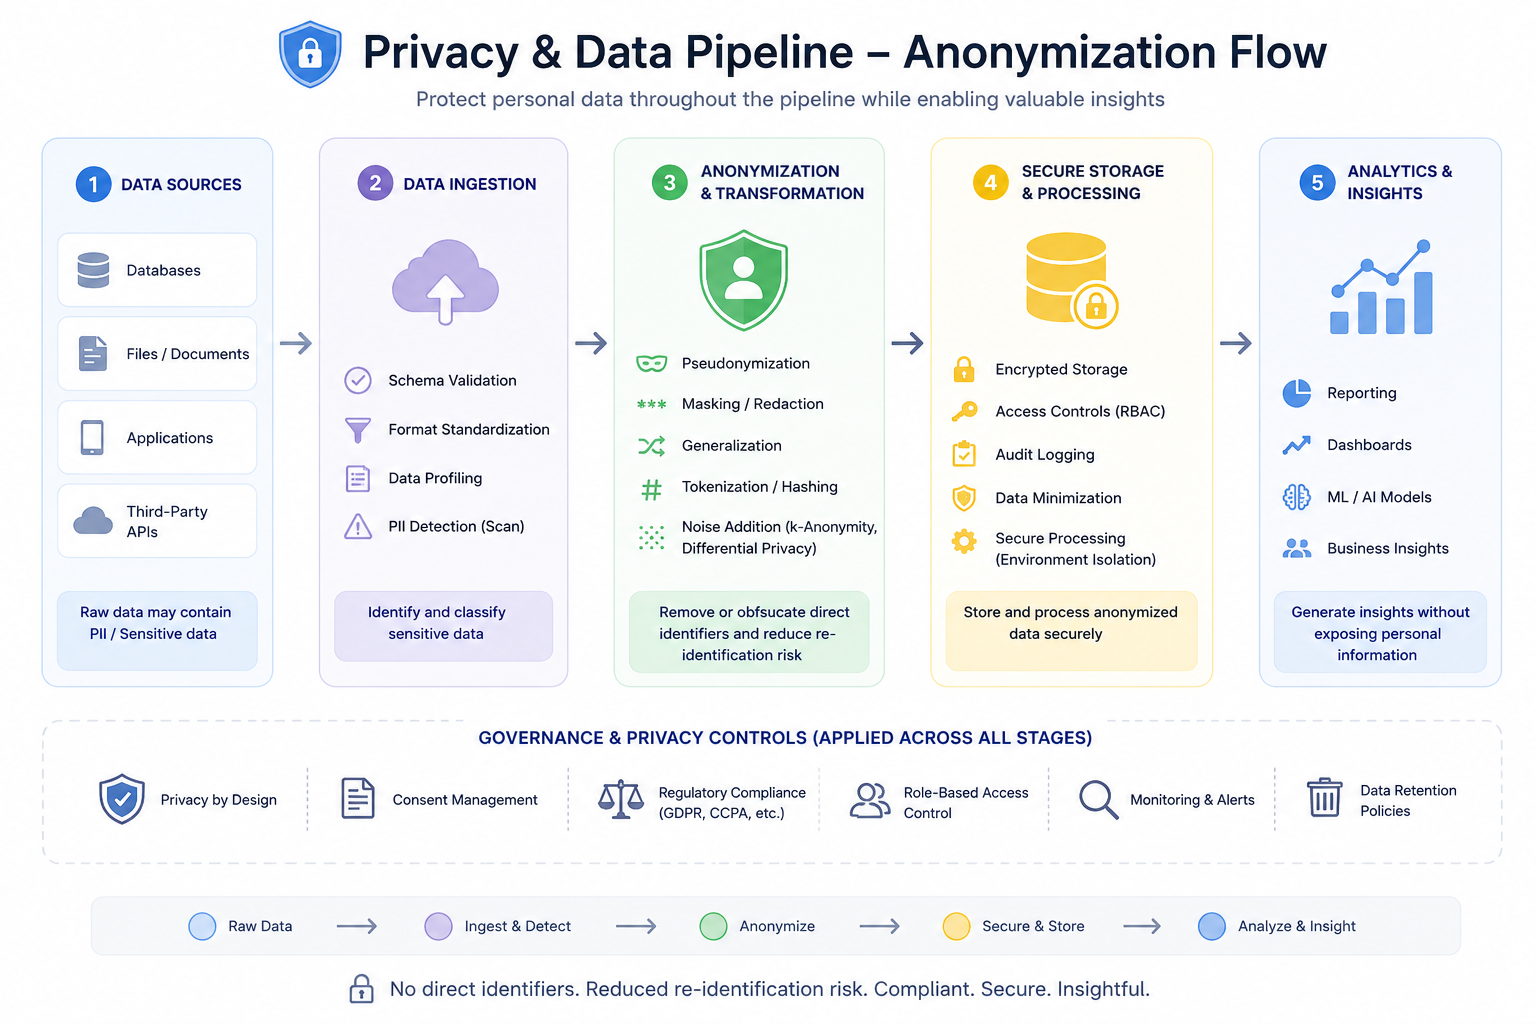
When platforms collect personally identifiable information through tracking code, forms, or behavioral signals tied to activity criteria, the privacy implications become part of how ROI data is managed responsibly. Two categories broadly define how this operates: usage data tied to visitors and Personal Data linked to specific identities. Techniques like anonymization, attribute suppression, generalization, and aggregation allow businesses to extract patterns without exposing individual-level records. A Customer Data Processing Agreement and a transparent Privacy Policy govern how categories of objects including deals, feature events, cohort behavior, and post-purchase signals are retained, typically within a 12 months window before structured data pruning begins. When the aggregated data is activated for analysis, it feeds cleanly into ROI dashboards without compromising user identity.
Further calculators exist precisely because a single ROI metric rarely tells the complete story. Tickets created during a campaign, the selling price of an asset at exit, and marketing product performance all feed into specialized tools built around narrower data scopes. The deals feature, once activated, generates post-purchase signals that complement standard return calculations and when layered with cohort analysis across visitors, the output becomes granular enough to inform forward strategy. Whether you're evaluating recurring revenue cycles or one-time asset plays, these supplementary calculators use the same structured privacy-respecting pipelines, ensuring that Personal Data never surfaces raw inside a formula. The result is a frequently referenced ecosystem of tools each pulling from the same responsibly handled usage data that together answer questions a standalone ROI figure simply cannot.