
Internal Rate of Return (IRR) Calculator
Introduction
Every analyst's first encounter with the internal rate of return usually unfolds the same way: a borrowed spreadsheet, a column of cash flows, and a formula that refuses to make sense until the discount rate finally drags net present value NPV down to zero. That break-even moment is where the whole concept actually lives. The Internal Rate Of Return isn't a number you calculate so much as a number you hunt for, nudging a percentage rate up and down until the discounted series of inflows and outflows balances against the initial investment. I've watched people treat that single figure as the entire verdict on a deal, when it was really only ever meant as a compass pointing toward whether future earnings justify the money committed today.
Step back far enough and the IRR is really just one dialect in a family of return languages built around the time value of money. Money today isn't money in five years, and every cash proceeds figure carries a string of dates that must be translated back through compounding before it means anything. Practitioners often forget that the hurdle rate, or minimum required rate of return, they're measuring against is itself borrowed from the cost of capital. A project gets accepted or rejected less because of the math and more because of where that benchmark was set. Present value math, run on an annualized basis, produces a compound annual rate of return, a figure economists sometimes prefer to call the economic rate of return, or ERR, especially once external factors like inflation start eating into the prevailing interest rate. Compare that to the multiple of invested capital, or MOIC, which mostly ignores period and simply asks how many dollars came back relative to what went out a time-weighted measure it is not, and a yield it only loosely resembles, but in deals where costs are murky and a full discounted cash flow rate of return feels like overkill, MOIC still earns its place at the table.
IRR Formula
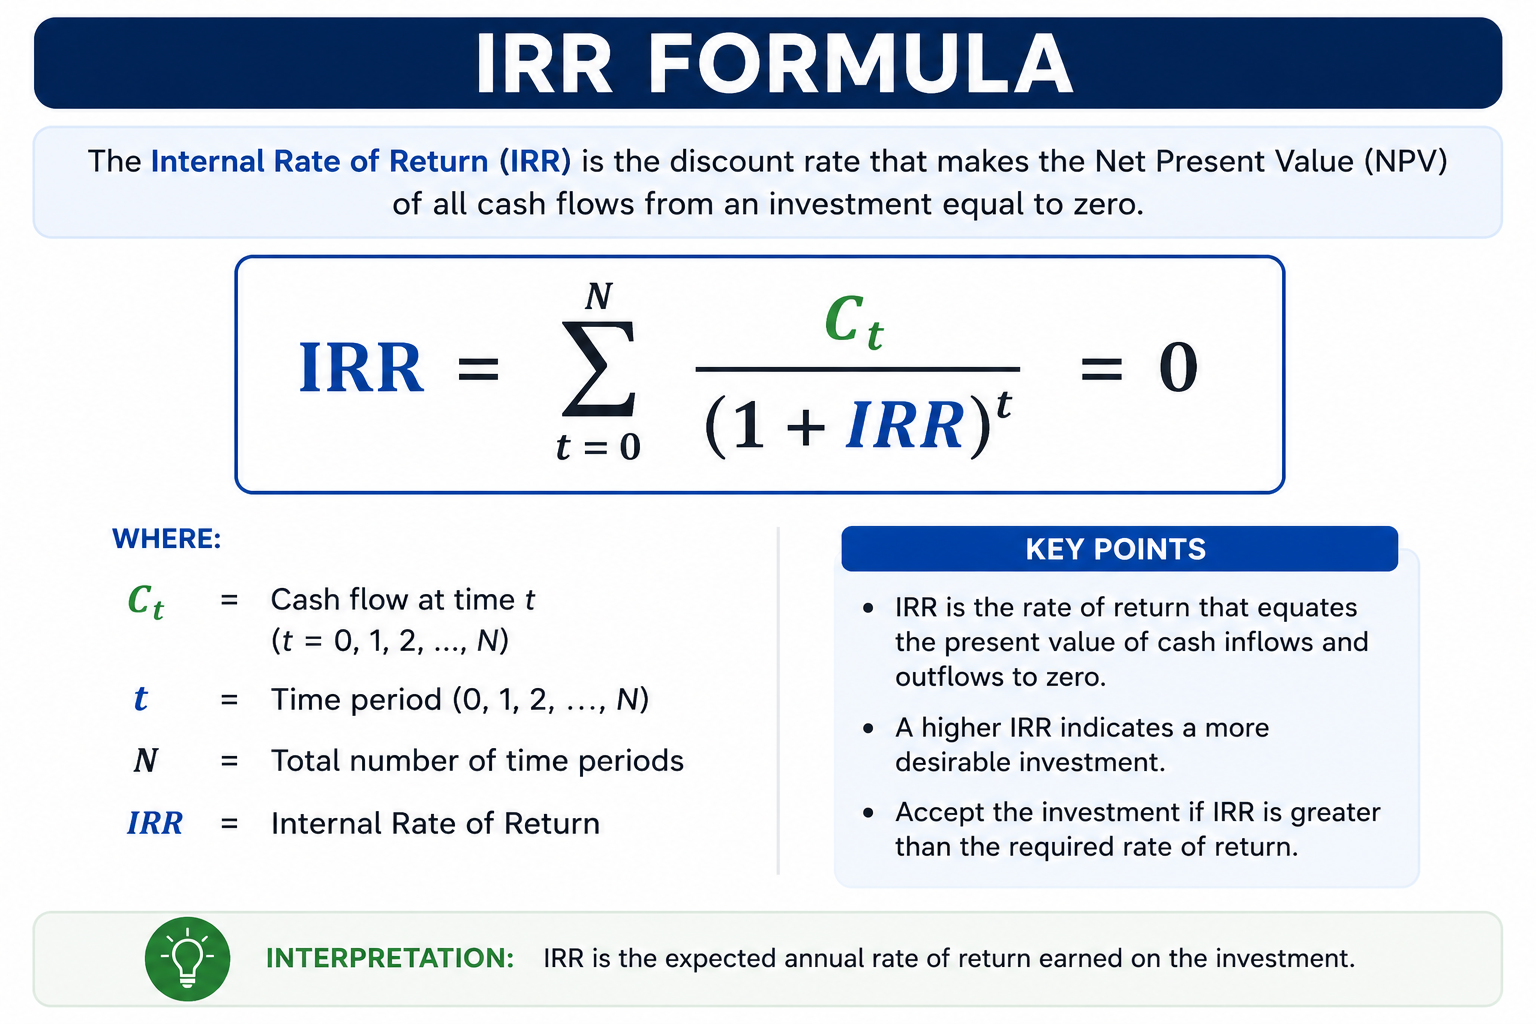
The IRR or Internal Rate of Return functions as the discount rate that drives the net present value of all projected cash flows to exactly zero, making it one of the sharpest tools in capital budgeting and investment analysis. Unlike blunt percentage metrics that ignore sequencing, IRR accounts for the precise timing of every inflow and outflow, which is why seasoned financial analysts trust it over static ROI figures when evaluating project viability. The underlying formula works through an iterative process there is no clean algebraic solution so whether you're using Excel's =IRR() function, a TI-84, or an HP 12c, the engine is essentially trial and error: plugging successive discount rates into the NPV equation until the result converges on zero. In Excel, feeding cash flows in chronological order beginning with the initial investment entered as a negative value, followed by positive inflows gives you the IRR in one pass with =IRR(B2:B6). What makes the metric genuinely powerful in corporate finance is that it converts the entire discounted cash flow picture into a single, communicable annualized rate of return that decision-makers can benchmark instantly against a hurdle rate or cost of capital no currency-based translation required.
How to Calculate IRR
The internal rate of return sits at the heart of capital budgeting but few practitioners talk about how the calculation itself shapes the way you think about a project. Rather than starting with a formula and working forward, experienced financial analysts often reverse-engineer from the hurdle rate: if your required rate of return is 10%, you're not really solving for an unknown, you're testing whether the discount rate that drives net present value to zero clears that bar. The IRR formula works through a recursive numerical search, meaning there's no clean algebraic solution. You're iterating through discount rates, call it plug and chug if you like until the present value of all future cash flows (discounted at rate r across n time periods) nets against your initial investment (represented as CF0, a negative value) to reach exactly zero. This is why trial and error remains a legitimate manual method, even if Excel's =IRR() function or a financial calculator like the TI-84 or HP 12c handles the iterative process in seconds.
What many overlook is how cash flow timing fundamentally distorts the result. Feed your inflows and outflows in chronological order at regular intervals yearly, quarterly, or monthly and the IRR function in Excel (syntax: =IRR(B2:B6)) or Google Sheets produces a clean annualized rate of return. But real investments rarely behave that cleanly. When cash flows are non-periodic or arrive at variable time intervals, XIRR (Extended Internal Rate of Return) becomes the more accurate tool, since standard IRR assumes fixed periods. Beyond the mechanics, the deeper discipline is in structuring your CF1, CF2, through CFn inputs honestly revenues, costs, salvage value, acquisition costs, and any interim cash flows must reflect forecasted reality, not optimism. A manufacturing firm evaluating a machine at $40,000 with returns of $10,000, $20,000, and $30,000 across years 1, 2, 3 lands at roughly 19.438% a number only meaningful when stacked against the cost of capital and weighed alongside NPV and MIRR for a fully informed investment decision.
Trial and Error Method (Manual Calculation)
Among practitioners who've worked through IRR calculations by hand, the trial and error method sometimes called plug and chug reveals something textbooks rarely emphasize: the process itself builds intuition that spreadsheet software never quite replicates. Rather than reaching immediately for Excel or online calculators, working manually through discount rates forces you to internalize how shifting a percentage even slightly reshapes the entire net present value outcome. The mechanic is straightforward: you select a discount rate, compute the NPV of all projected cash flows, and observe whether that result lands above or below zero. When it doesn't hit zero, you adjust, recalculate, and narrow the gap iteratively. This iterative process isn't inefficiency; it's calibration, and analysts who've done it repeatedly develop a near-instinctive sense of where the IRR will settle before they've finished the arithmetic.
What makes this approach genuinely instructive is how it exposes the relationship between future cash flows and the initial investment in a way that an algebraic solution obscures. Each analyst running this manually must confront the formula at its core, discounting each CF value back through time periods until the aggregate present value balances against the upfront cost. In personal experience evaluating early-stage project proposals, running even a rough trial and error pass before touching =IRR() often caught structuring errors that automated tools silently absorbed. The method also makes the absence of an analytical solution feel less like a limitation and more like a feature; it reminds decision-makers that IRR is fundamentally a breakeven point derived from assumptions, not a fixed truth embedded in the cash flow sequence itself.
Calculating IRR in Excel
Excel remains one of the most field-tested environments for running an iterative process on IRR calculations, and practitioners who've worked through trial and error manually tend to appreciate why. Rather than plugging discount rates into the equation one by one essentially doing plug and chug by hand Excel's built-in =IRR() collapses that recursive search into a single cell reference. The analyst simply arranges cash flows vertically, from the negative outlay at period zero through each subsequent inflow, then lets the function iterate until it finds the discount rate that drives NPV to zero. What's less discussed is the Goal Seek feature: when you want to reverse-engineer a specific net present value, set the NPV formula cell to zero and let Goal Seek solve for the percentages a workflow that gives you the same result while keeping the logic transparent and auditable at every step.
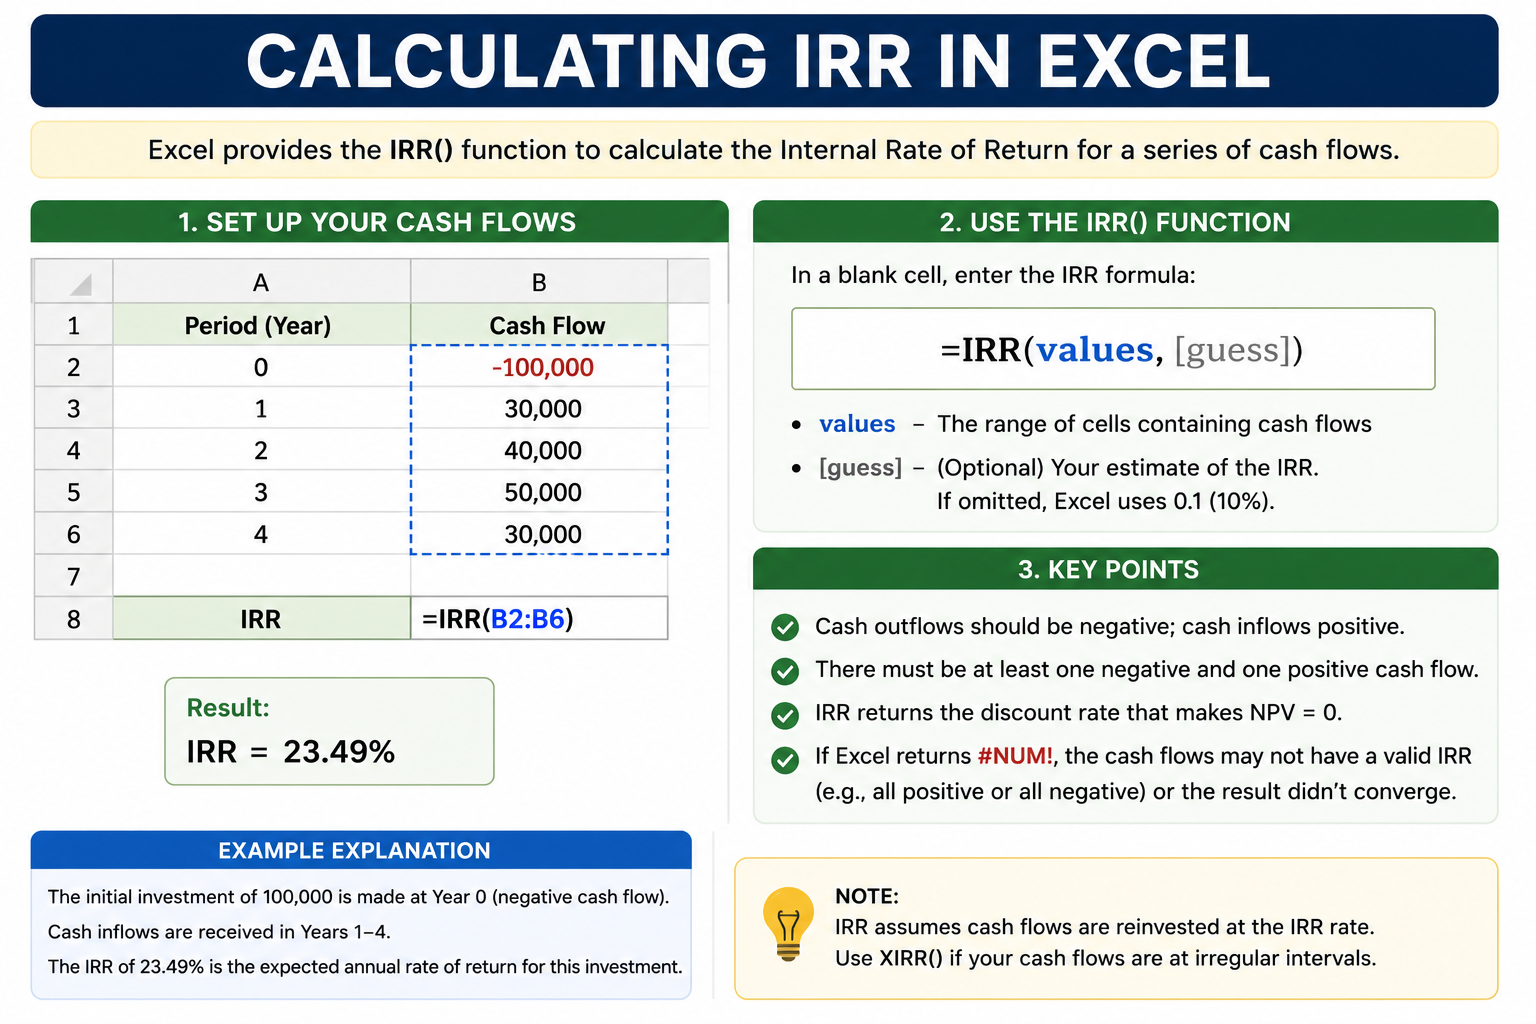
Where Excel genuinely separates itself is in handling irregular timing through XIRR, which accepts non-periodic and irregular cash flows that the standard =IRR() function can't accommodate. Consider a scenario similar to the Machine 1 versus Machine 2 comparison common in capital budgeting: one asset generates inflows in Year 1, Year 2, and Year 3 at $210,000, $237,000, and $265,000 respectively, while a competing machine returns $181,000, $190,000, and $203,000 over a three-year lease. Running both through Excel initial costs of $500,000 and $400,000 produces IRRs near 19.13% and 20.04%, with intermediate NPV checks yielding figures like –$7,060.19, $1,086.84, $254.63, and –$0.95 as the guess converges. At 20% and 19% trial rates, the direction of error tells you exactly which way to nudge the next iteration. This hands-on feedback loop watching the net present value oscillate before locking builds an intuition for time periods and discount factor sensitivity that no black-box calculator replicates.
Calculating IRR in Google Sheets
Setting up your cash flows in chronological order is the non-negotiable first move whether you're working through a three-year lease evaluation or a four years capital project. Google Sheets handles the iterative process the same way Excel does, since both rely on the =IRR() function syntax. You input your initial investment as a negative value representing outflows, then list each year's inflows in sequential cells say –$100,000 as CF0 followed by $8,000, $150,000 across subsequent rows and the function resolves the discount rate that drives NPV to zero through a recursive numerical search behind the scenes, identical to the trial and error logic a financial analyst would apply manually. What separates seasoned practitioners from beginners here is understanding that Goal Seek becomes your fallback when the =IRR() formula returns an error typically when alternation between positive cash flows and negative cash flows creates multiple solutions or no solutions so you'd manually set the net present value formula to zero by varying the r cell across tested discount rates like 10%, 13%, or 19% until convergence. Google Sheets also supports XIRR for non-periodic or irregular cash flows where fixed periods of years, quarters, or months don't apply, giving you flexibility that the standard =IRR(B2:B6) syntax simply can't accommodate a distinction that matters enormously when variable time intervals define a real estate or venture capital deal timeline.
How to Use the IRR Calculator
Practitioners working in corporate finance or personal investing rarely talk about how they actually run numbers through an IRR calculator; they jump straight to interpreting results. But the iterative process behind using one deserves attention. Start by entering your initial investment as a negative outflow; this is your CF0, the upfront cost that anchors everything. Then feed in your forecasted net cash flows period by period: yearly, quarterly, or monthly, depending on whether you're evaluating a three-year lease, a five-year holding period, or something more irregular. Tools like Excel (=IRR()), Google Sheets, TI-83, TI-84, and HP 12c financial calculators all handle the recursive numerical search behind the scenes what used to require plug and chug trial and error across multiple discount rates is now resolved with a single formula. For non-periodic cash flows, the XIRR function handles variable time intervals more accurately, since standard IRR assumes fixed periods.
What separates informed users from casual ones is knowing when the calculator's output demands a second look. A single percentage number is clean and easy to communicate, but experienced decision-makers cross-reference it against the hurdle rate, the minimum acceptable rate of return set by cost of capital or benchmarking against comparable investment opportunities. If you're analyzing multifamily real estate or commercial real estate, multifamily investment IRR calculators and commercial real estate IRR calculators are purpose-built to handle purchase price, rental income, maintenance costs, and sale price inputs across disparate sizes from $7 million to $140 million portfolios. Always run IRR alongside NPV rather than in isolation; the NPV rule grounds the percentage return in real dollars, while the payback period and equity multiple fill in gaps that one-size-fits-all metrics miss. The goal isn't just to get a number it's to use that number as one piece of a set of complementary metrics that together support a genuinely informed decision.
IRR Examples
Evaluating Two Manufacturing Machines Using Trial and Error
A financial analyst working in capital budgeting once handed me two proposals side by side Machine 1 and Machine 2 each demanding a hard look at future cash flows before any capital allocation decisions could be made. Machine 1 required an initial investment of $500,000, while Machine 2 came in lighter at $400,000, both structured under a three-year lease arrangement. The cash flows for Machine 1 across Year 1, Year 2, and Year 3 were $210,000, $237,000, and $265,000 respectively. Machine 2 delivered $181,000, $190,000, and $203,000 across the same time periods.
Rather than jumping straight to spreadsheet software, I ran a trial and error method, the classic plug and chug, adjusting discount rates until the net present value approached zero. Starting at 20%, the NPV for Machine 1 came out at –$7,060.19. Dropping to 19% flipped it to $1,086.84. After further narrowing, 19.13% landed at $254.63, and 20.04% settled at –$0.95 effectively the breakeven point. This iterative process confirmed Machine 1's IRR sat just above 19%, making it the stronger pick once weighed against the hurdle rate and total outlay. The equation never lies when you work it patiently enough.
Venture Capital Fund Comparing a Short-Duration vs. Long-Duration Deal
In venture capital and private equity, the debate between a one-year sprint and a five-year hold rarely gets resolved cleanly. I've watched funds wrestle with exactly this: Project A posted an IRR of 25% over a compressed one-year window, while Project B returned an IRR of 15% stretched across a five-year horizon. On the surface, Project A wins but seasoned general partners and limited partners both know that durations distort the picture.
The IRR decision rule says take the higher IRR, yet mutually exclusive projects with mismatched durations demand more scrutiny. A 30% IRR on a $10,000 deal generates far less absolute dollar value than a disciplined 15% to 20% return deployed across a $1,000,000 commercial real estate position. Venture capital benchmarks in aggressive growth strategies routinely target 30%+, whereas lower-risk assets in CRE are comfortably profitable at 15% to 20%. The hurdle rate 12% floors the conversation; anything below it gets dropped, anything above gets taken. Smart funds never let a flashy higher IRR on a thin deal crowd out a steadier, larger-capital Project B that's where informed investment decisions separate the disciplined from the dazzled.
Real Estate Investor Running IRR on a Multifamily Property in Excel
A real estate investor I consulted was evaluating multifamily real estate investments using an IRR calculator built directly in Excel with the =IRR() function. The inputs were straightforward: purchase price as the CF0 (negative outflow), followed by annual net cash flow figures accounting for rental income minus maintenance costs, and a projected sale price at the fifth year inclusive of salvage value set at $160,000 on a terminal assumption of $50,000 in residual improvements.
The =IRR() formula processed the variable cash flow stream across n time periods, spitting back an annualized return that could be stacked against the required rate of return for commercial real estate typically 15% to 20% depending on risk and time horizons. What made this case instructive was the reinvestment assumption baked into standard IRR: it presumes all intermediate cash inflows get reinvested at the same rate, which in real-world multifamily real estate is often unrealistic. Switching to MIRR the Modified Internal Rate of Return with a separate reinvestment rate and financing rate equal to the cost of capital produced a more grounded number, improving economic accuracy and giving the investor a trustworthy return metric for benchmarking across disparate sizes and time horizons. Google Sheets with its financial functions and real-time collaboration features served the team projects side of the analysis just as effectively, enabling financial modelling and sharing across stakeholders without friction.
IRR Decision Rule
The decision rule governing IRR is deceptively straightforward, yet practitioners often misapply it by treating it as a one-size-fits-all verdict rather than a complementary signal. At its core, the rule compares a project's internal rate of return against the required rate of return often called the hurdle rate or cost of capital to determine whether an investment should be accepted or rejected. When IRR clears that threshold, the project signals a positive economic case; when it falls short, the NPV would land as a minus number, suggesting value destruction. What's less discussed is how the rule quietly embeds the time value of money into every verdict; it's not merely about percentage return, but about whether future cash flows, when discounting them back at the discount rate, still justify the initial investment.
Where the rule genuinely earns its weight is in capital budgeting, where companies must rank competing projects under constrained capital. A projected yield of 19.438% on a manufacturing machine costing $40,000 returning $10,000, $20,000, and $30,000 across years 1 2 3 comfortably clears a 10% benchmark, making it a clearly desirable allocation. But the rule breaks down when applied in isolation to mutually exclusive projects of different sizes or durations, where a small investment can post a high percentage return yet deliver negligible absolute dollar value in real dollars. Experienced financial analysts know to pair the IRR decision rule with NPV, MIRR, or payback period as complementary metrics because no single analytical tool should carry the full weight of an informed decision.
Applications and Uses of IRR
IRR serves as a universal language that financial analysts, investors, and decision-makers rely on when evaluating investment opportunities across entirely different asset classes from commercial real estate and venture capital to stock buyback programs and lease agreements. What makes this metric particularly compelling is how it compresses complex cash flow timing into a single annualized rate of return, allowing companies to rank competing projects by projected yield rather than gut instinct. In real estate, for instance, IRR lets real estate investors weigh rental income, maintenance costs, acquisition costs, purchase price, and eventual sale price against different time horizons simultaneously, something raw revenues and costs comparisons cannot achieve. Similarly, lenders applying IRR to financing options gain an immediate read on cost of financing, while corporations running capital allocation reviews use it to determine whether repurchasing company's own stock outperforms outside investment in terms of return.
Where IRR truly earns its place, though, is in settings where capital budgeting demands intellectual rigor beyond a simple payback period or static ROI. In private equity and venture capital, better-performing investments are surfaced quickly because IRR captures time value of money through discounting of future cash flows meaning interim cash flows and the timing of inflows and outflows both carry weightage in the final figure. Real estate investors comparing properties of disparate sizes or multifamily real estate deals with different time structures find IRR especially useful since it normalizes profitability into a percentage return regardless of scale. Even in manufacturing firm or restaurant financing scenarios, an IRR benchmarked against a hurdle rate or cost of capital say 8% or 10% tells management plainly whether a project is worthwhile or unwise, making it far more actionable than currency-based outputs or NPV figures alone when comparing alternatives at the initial investment stage.
IRR vs. Net Present Value (NPV)
A project that clears its hurdle on a percentage basis doesn't always win on a dollar basis, and that gap is exactly where the comparison between these two metrics gets interesting. Where IRR hunts for the discount rate that pushes a deal to zero NPV, the net present value approach starts from the opposite end, pinning a fixed rate and asking how much value survives once future cash gets pulled back to today's terms. I've sat across the table from operators who treated a high IRR like a trophy, only to find the underlying dollar value created was thin once stacked against a smaller, steadier alternative throwing off more absolute value in raw terms. That's the quiet trap: IRR is a percentage rate of return, blind to scale, while NPV reports in real dollars and therefore reflects size honestly. Run the two side by side across multiple projects and rankings often flip the ranking IRR hands you for a set of investment alternatives isn't always the one NPV would hand back, and reconciling that disagreement is half the craft of choosing where capital actually goes.
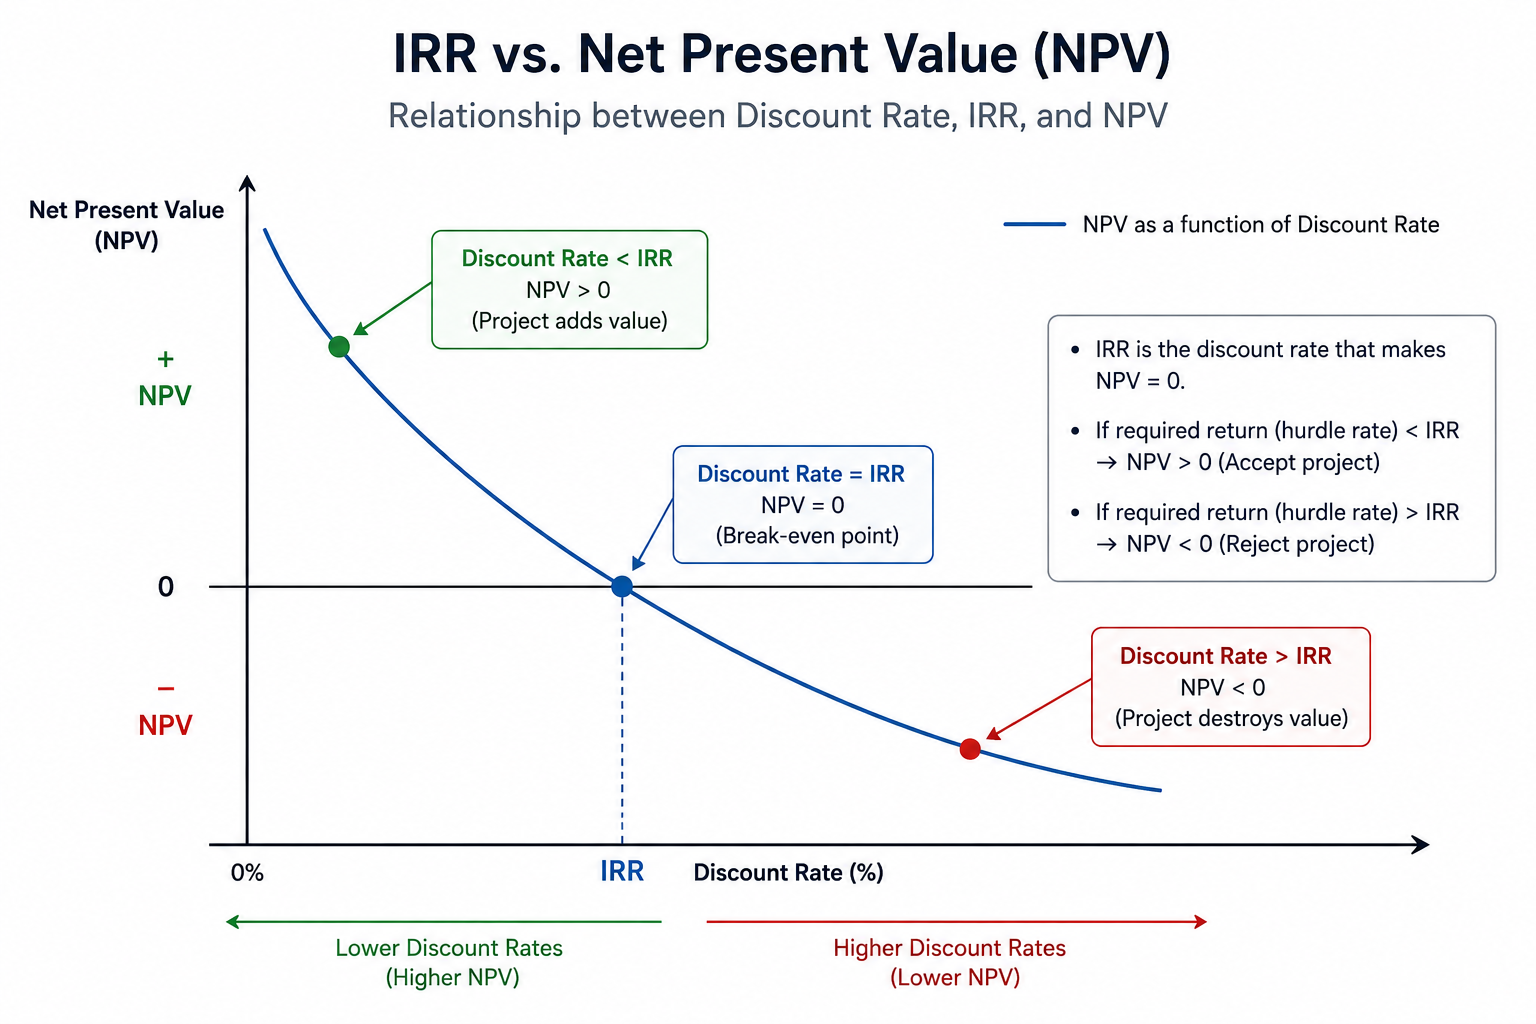
Where the disagreement really shows its teeth is the reinvestment assumption buried inside each model. IRR's math implicitly assumes every dollar that comes back gets put right back to work at that same lofty rate, which in the real world rarely holds up; NPV instead leans on the discounted cash flow rate of return as its reinvestment anchor, usually pegged closer to a firm's actual cost of capital, which makes it the steadier yardstick for mutually exclusive projects of different durations and risk profiles. None of this turns either tool into a sole determinant of where money goes I treat them as complementary metrics, supplemental perspectives that catch what the other misses, since a measure built around payback period speed says nothing about long-run profitability, and a single low absolute dollar value figure says nothing about the percentage returns an investor actually pockets. When positive cash flows stack up unevenly across equity multiple structures or fund vintages, pairing the two before any investment decision turns a coin-flip into an informed decision, and that habit alone has saved more than one round of capital allocation decisions I've watched go sideways.
IRR vs. Modified Internal Rate of Return (MIRR)
Practitioners who've worked through capital budgeting decisions long enough eventually hit a wall with IRR not because the metric fails conceptually, but because it carries a quietly unrealistic assumption baked into its math: that all intermediate cash inflows get reinvested at that same rate. In real-world project analysis, this rarely holds. The MIRR, or Modified Internal Rate of Return, was built precisely to correct this; it separates the reinvestment rate from the discount rate, applying a more defensible economic accuracy to what would otherwise be an inflated figure. I've seen financial analysts overlook this distinction entirely on long term deals, only to discover mid-cycle that their projected annual profitability numbers were products of an analytical tool optimized for clean assumptions, not messy markets.
Where IRR operates as a single percentage that forces both inflows and outflows through the same discount factor, MIRR untangles that knot using your actual required rate of return as the reinvestment rate on positive flows while discounting negative cash flows to present value at the finance cost. This produces a unique figure that's harder to game and closer to what a viable investment actually yields. The tradeoff? MIRR demands more inputs and slightly more setup, which is why many teams still default to NPV for absolute dollar amounts and lean on MIRR only when alternation in cash flow signs makes standard IRR unreliable or non-unique. Used together, though, they form a genuinely sharper lens for investment decisions especially when different durations or unconventional cash flow timing are involved.
Advantages and Disadvantages of IRR
IRR earns its place in investment analysis not because it's flawless, but because it compresses complex future cash flows into a single annualized percentage return that analysts and lenders alike can immediately act on. Where NPV tells you magnitude in dollars, IRR gives you relative efficiency a lens through which project proposals across different sizes and different durations can be lined up and ranked without needing to normalize for capital cost or initial investment. From evaluating lease agreements to stock buyback programs run by corporations, the metric functions as a standardized metric for benchmarking that strips away noise. In private equity and venture capital, general partners (GPs) rely on both Gross IRR and Net IRR after accounting for management fees and carry interest to communicate performance to limited partners (LPs) with a clarity that raw total returns rarely achieve. When a manufacturing firm weighs a bank loan against an alternative investment, or a restaurant evaluates whether expansion is worthwhile, IRR delivers the projected yield in terms that make the return on investment immediately comparable to a hurdle rate the minimum acceptable rate of return without demanding deep quantitative fluency from every decision-maker in the room.
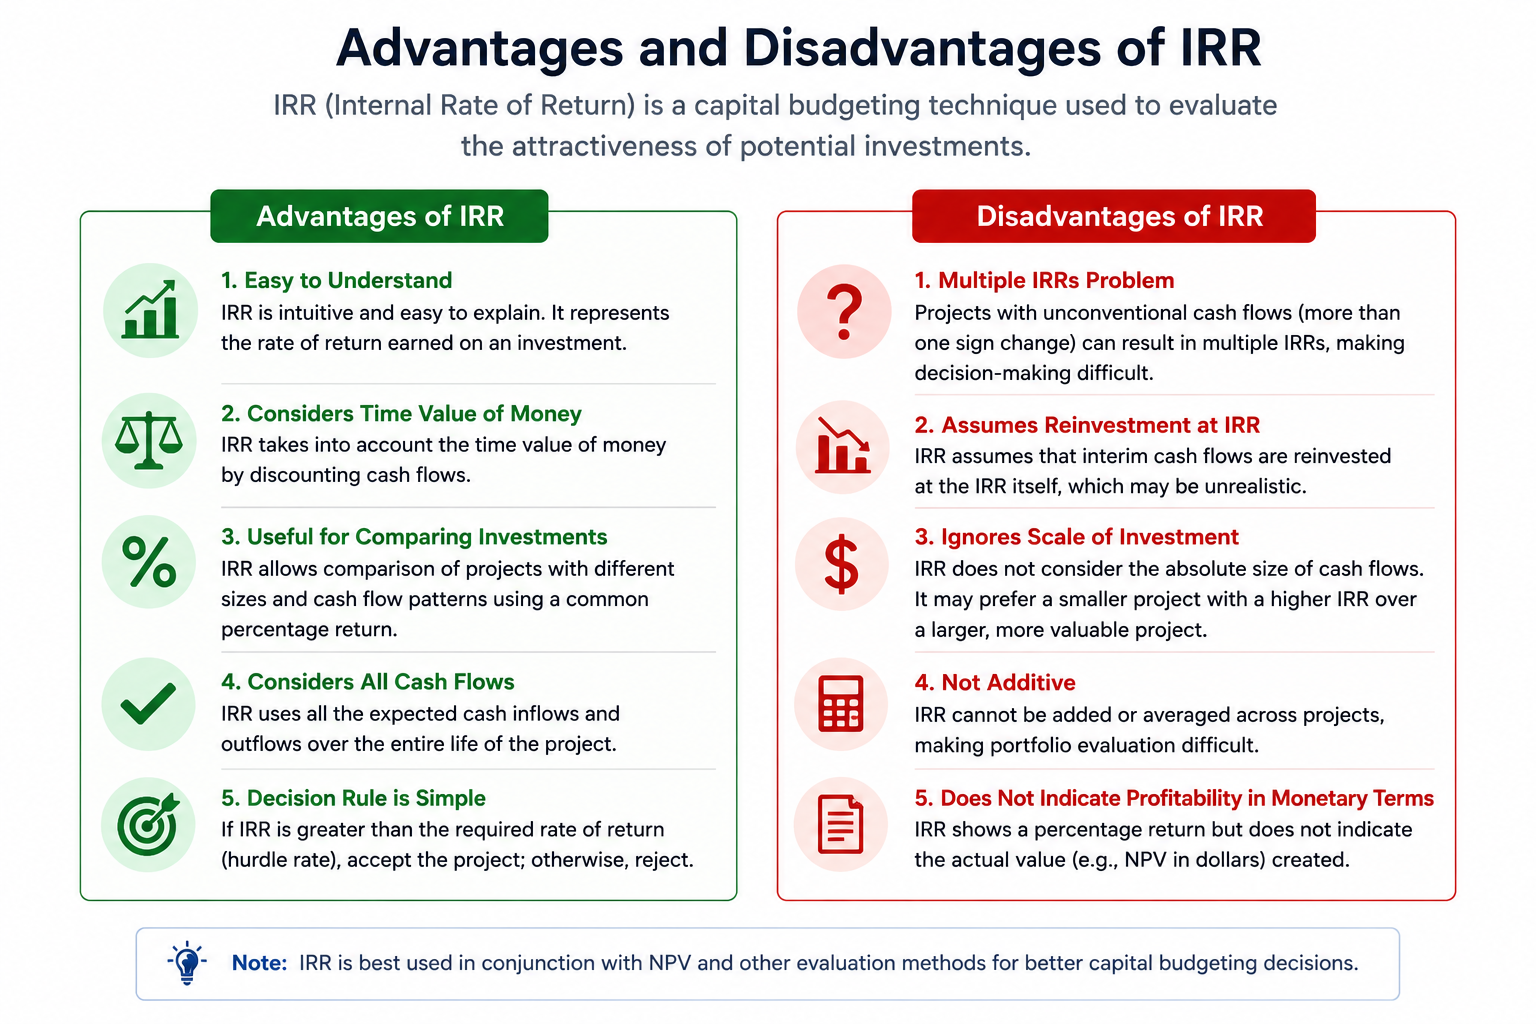
The friction begins where IRR's elegance breaks down. The metric carries a structural assumption that interim cash inflows are reinvested at the same IRR itself, an assumption that turns dangerously volatile when returns are high, quietly inflating project profitability beyond what real estate or fund portfolio conditions can sustain. Negative IRR scenarios where cash outflows consistently exceed cash inflows over time expose another gap: IRR alone cannot tell you whether a losing investment is losing marginally or catastrophically, since it strips away total profit in dollars and reports only the yearly growth rate. For prospective projects with non-periodic cash flows or variable time intervals, the standard =IRR() formula in Excel can produce unique but misleading results, which is why XIRR the Extended Internal Rate of Return exists for irregular cash flows across variable amounts and fixed periods like months or quarters. Poor decisions often trace back to treating IRR as a determinant rather than one signal among several metrics: a profitable investment on paper may carry risk in its revenues and costs structure that only NPV, the payback period, or qualitative factors would surface. Relying on IRR alone without IRR with NPV cross-validation or hurdle rate comparison is how project evaluation quietly fails even experienced analysts.
Frequently Asked Questions (FAQs)
IRR or the Internal Rate of Return sits at the center of nearly every serious project evaluation conversation, yet practitioners still wrestle with questions that go beyond the formula itself. Having worked through investment analysis across real estate, private equity, and capital budgeting contexts, I've seen firsthand how even experienced analysts misapply this standardized metric when they skip the foundational questions. Here are the answers that actually matter.