
Total Return Calculator: Estimate Your Investment's Total Gain
How to Use This Total Return Calculator
This calculator helps you estimate the total return on your investment, combining both price gain/loss and any income received.
Note: This calculator provides an estimate for planning purposes only and does not constitute financial advice.
What Is Total Return and Why It Matters More Than Price Change Alone
Total return measures the complete gain or loss an investment produces, including both capital appreciation and income earned through dividends and interest, rather than tracking only the stock price change investors often watch very closely.
Many beginners confuse price return with actual performance, assuming a rising chart tells the whole story. But price return vs total return differs sharply once you factor in cash payments an investment generates over time.
Investment income often makes up a large share of long-term gains, especially for dividend-paying stocks and interest-bearing bonds. Ignoring this income return component can lead investors to underestimate how much wealth a holding really built.
Understanding why total return matters becomes clear once you compare two similar assets. One asset with flat price but steady payouts can outperform another that only rose in price, once total return meaning is calculated.
This distinction also matters for performance measurement across your portfolio. Comparing realized vs unrealized return, alongside investment gain from both price and income, gives a far more accurate and complete view than watching price alone.
The Total Return Formula Explained
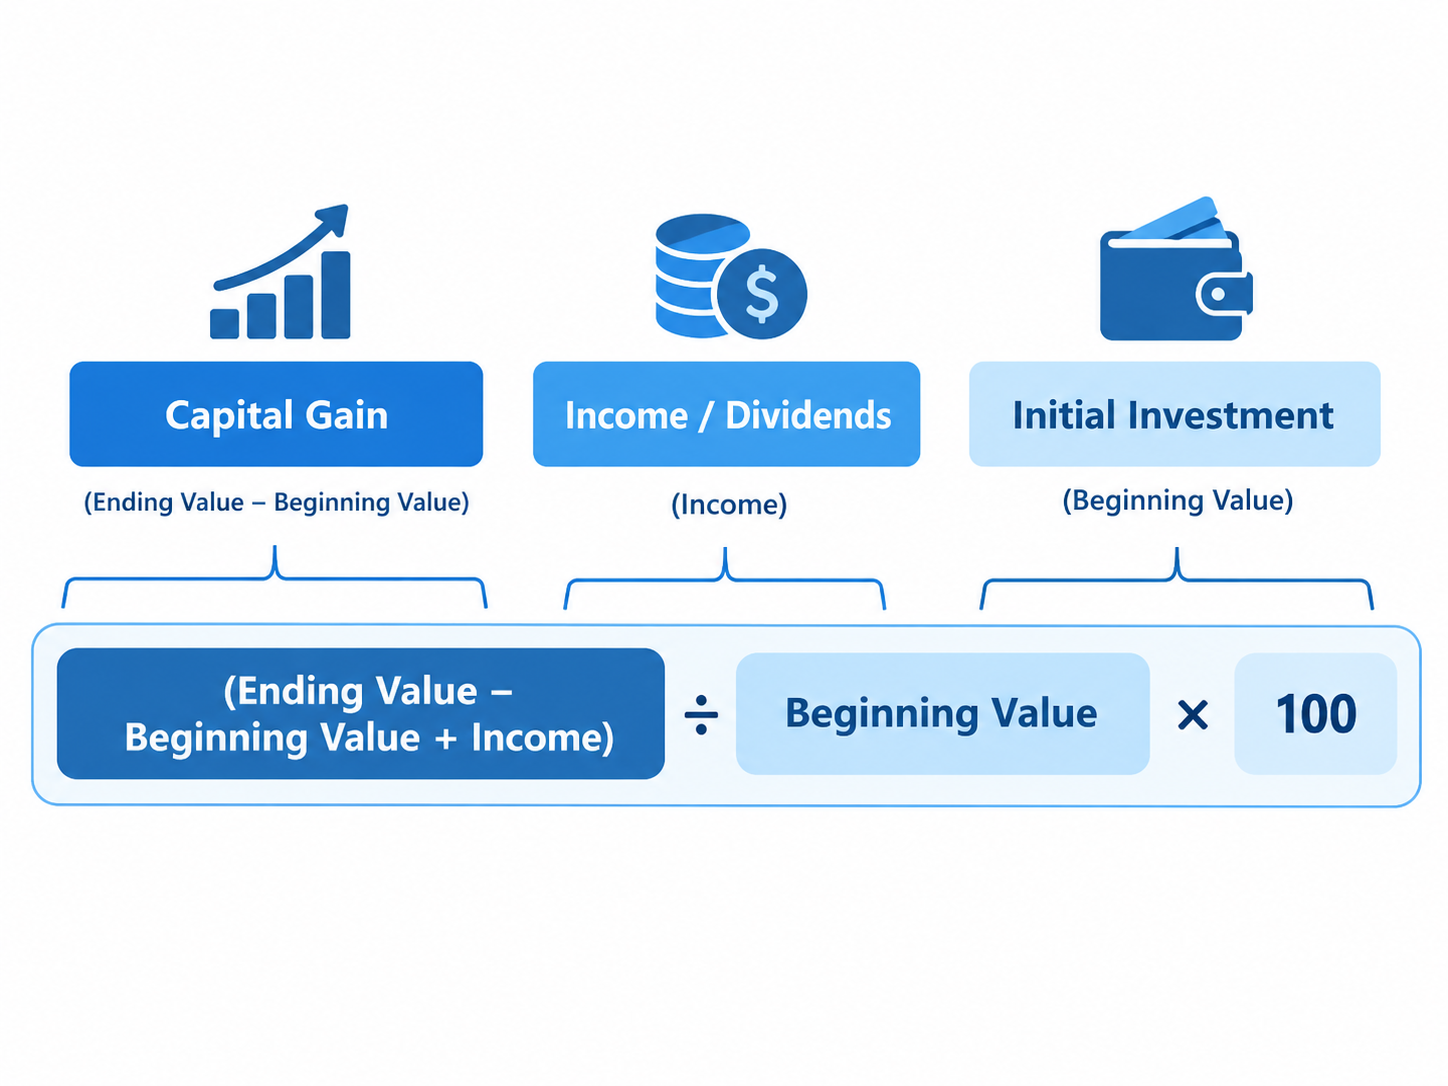
The total return formula combines price movement with income received during the holding period, expressed as one percentage figure. This formula breakdown helps investors see how each component contributes to overall investment performance over time.
In its simplest form, total return equals the ending value minus the beginning value, plus any income received, divided by the beginning value. This total return equation applies across stocks, bonds, funds, and other assets.
The capital gain formula portion reflects only price appreciation, calculated as ending price minus initial investment cost. Meanwhile, the income portion adds dividends paid or interest earned, capturing cash flows the investment generated over time.
Some investors separate the calculation into two yields for added clarity. The capital gains yield shows price-based gains alone, while the dividend yield shows the income component, and together they form the full percentage return.
This percentage return formula works whether you hold an asset for months or decades. Once you know the final value and total income collected, calculating total return becomes a straightforward exercise, not a guessing game.
Total Return for Stocks (Price Appreciation + Dividends)
For stock total return, the calculation adds share price appreciation to dividend income collected during ownership. This figure reflects what a shareholder earned, not just how the stock's quoted price moved on any given day.
The per-share formula starts with the selling price minus the cost basis, then adds dividends received per share. Dividing this sum by the cost basis produces the total return percentage for that dividend paying stock.
A quick stock example calculation helps illustrate this concept clearly. Buying shares, collecting payouts, and later selling combines both the capital gains yield and dividend yield into one measurable figure for equity total return analysis.
Total Return for Bonds (Price Change + Coupon Interest)
Bond total return accounts for both bond price change and the coupon payments collected throughout the holding period. Because bond prices fluctuate with rates, this combined measure paints a fuller performance picture than price alone.
It is important to separate yield to maturity vs total return, since yield to maturity assumes holding until maturity with reinvested coupons. Total return can differ once accrued interest and par value shifts are considered.
The bond total return formula combines price change with total interest income received, divided by the original purchase price. Adding bond reinvestment of coupons over time further boosts overall fixed income return for long-term bondholders.
Total Return for Mutual Funds and ETFs
Fund total return reflects the change in NAV change alongside any distributions paid to shareholders during the period. This figure gives a truer sense of fund performance than simply watching the fund's daily quoted price.
Capital gains distributions and dividend distributions both count toward total return, even when investors do not withdraw the cash. The ETF total return formula typically assumes these payouts are properly reinvested into additional fund shares.
One overlooked factor is expense ratio impact, which quietly reduces total return NAV over time through ongoing management costs. Comparing funds using reinvested distributions helps investors judge true performance after fees are properly accounted for.
Total Return for Real Estate Investments
Real estate total return combines rental income collected from tenants with property appreciation in market value over the holding period. This dual-source structure makes property returns fundamentally different from most publicly traded securities like stocks.
The property total return formula typically uses net operating income divided by property value, added to the percentage price gain. This produces a cash flow return figure reflecting both ongoing income and long-term value growth.
Investors comparing real estate ROI often separate rental yield from capital appreciation property gains for clearer analysis. Viewing appreciation plus income together shows the complete economic benefit a rental property delivered during the ownership period.
Total Return vs. Other Return Metrics (ROI, CAGR, Annualized Return)
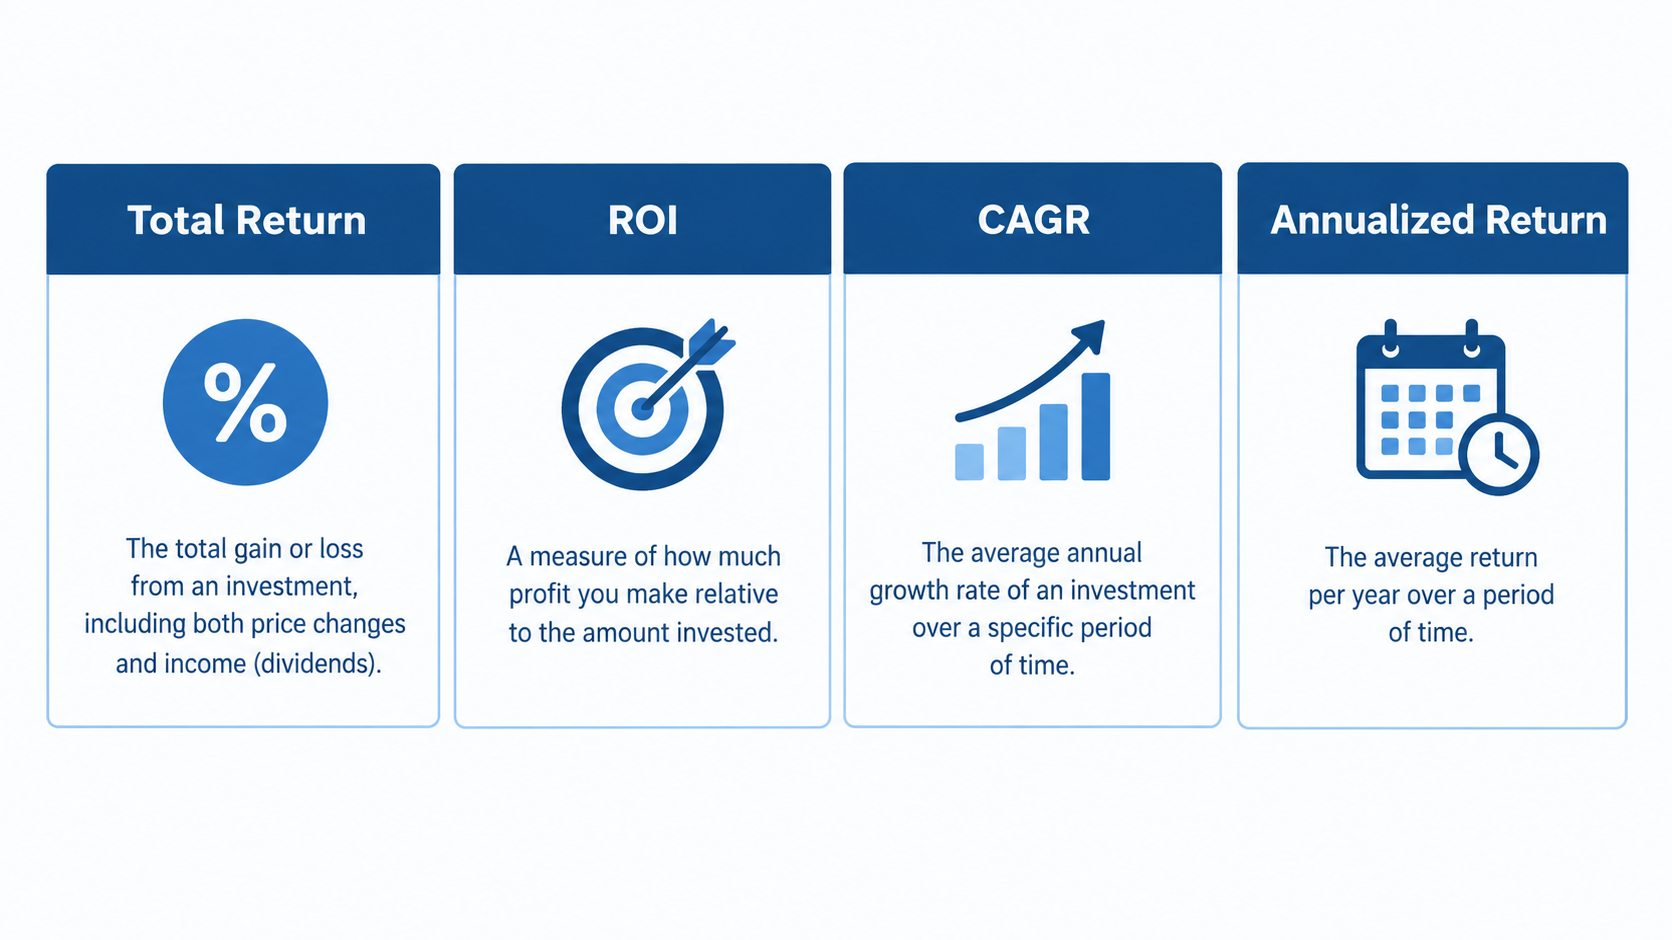
Comparing total return vs ROI reveals an important distinction between two commonly used performance measures. While ROI often ignores timing, total return captures the complete percentage gain including both price movement and income collected together.
The ROI formula typically divides net profit by original cost, without adjusting for how long the investment was held. This makes ROI simple but limited compared to more complete return metrics comparison methods analysts use.
Meanwhile, total return vs CAGR highlights how annualizing performance changes the picture entirely. The CAGR formula smooths returns across multiple years, showing a consistent compound annual growth rate instead of just one lump percentage figure.
Understanding simple return vs compound return helps explain why two investments with identical total gains can look different once annualized. This distinction becomes especially important when comparing investment horizon lengths across several unrelated opportunities carefully.
Choosing which metric to use depends on your specific comparison goal and overall context. Time-weighted return suits fund performance evaluation, while money-weighted return better reflects an individual investor's actual cash flow timing and personal decisions.
When to Use Total Return vs. CAGR
Knowing when to use CAGR becomes clearer once you need a multi-year comparison between investments held for different lengths of time. CAGR converts uneven yearly performance into one smooth, easily comparable annual growth figure overall.
CAGR is especially useful for smoothing volatility across years with sharp ups and downs in performance. This makes the CAGR use case ideal when comparing investments fairly despite different holding periods or inconsistent yearly swings.
By contrast, the total return use case fits best when you simply want the full percentage gain over one holding period. Recognizing these time period differences helps you select the right tool for annualizing returns.
Nominal vs. Real (Inflation-Adjusted) Total Return
Nominal return reflects your investment's percentage gain without accounting for rising prices elsewhere in the economy. This figure can overstate progress, since it ignores how much your money's purchasing power changed over the same period.
Real return adjusts nominal figures using an inflation adjustment, typically based on CPI adjustment data published by government agencies. This adjustment reveals whether your investment grew your buying power, not just its raw dollar value.
The real vs nominal formula generally subtracts the inflation rate from your nominal gain for a rough estimate. For more precision, analysts often apply the Fisher equation, which accounts for compounding between inflation and returns.
Understanding the cost of inflation matters most over long holding periods, where even modest annual inflation compounds significantly. This long-term inflation effect can quietly erode gains that appeared strong when measured only in nominal terms.
Using an inflation-adjusted total return figure, sometimes produced through deflating returns, gives a clearer picture of true purchasing power gained. A dedicated real return calculator can simplify this adjustment for everyday investors reviewing their portfolios.
The Impact of Dividend Reinvestment (DRIP) on Total Return
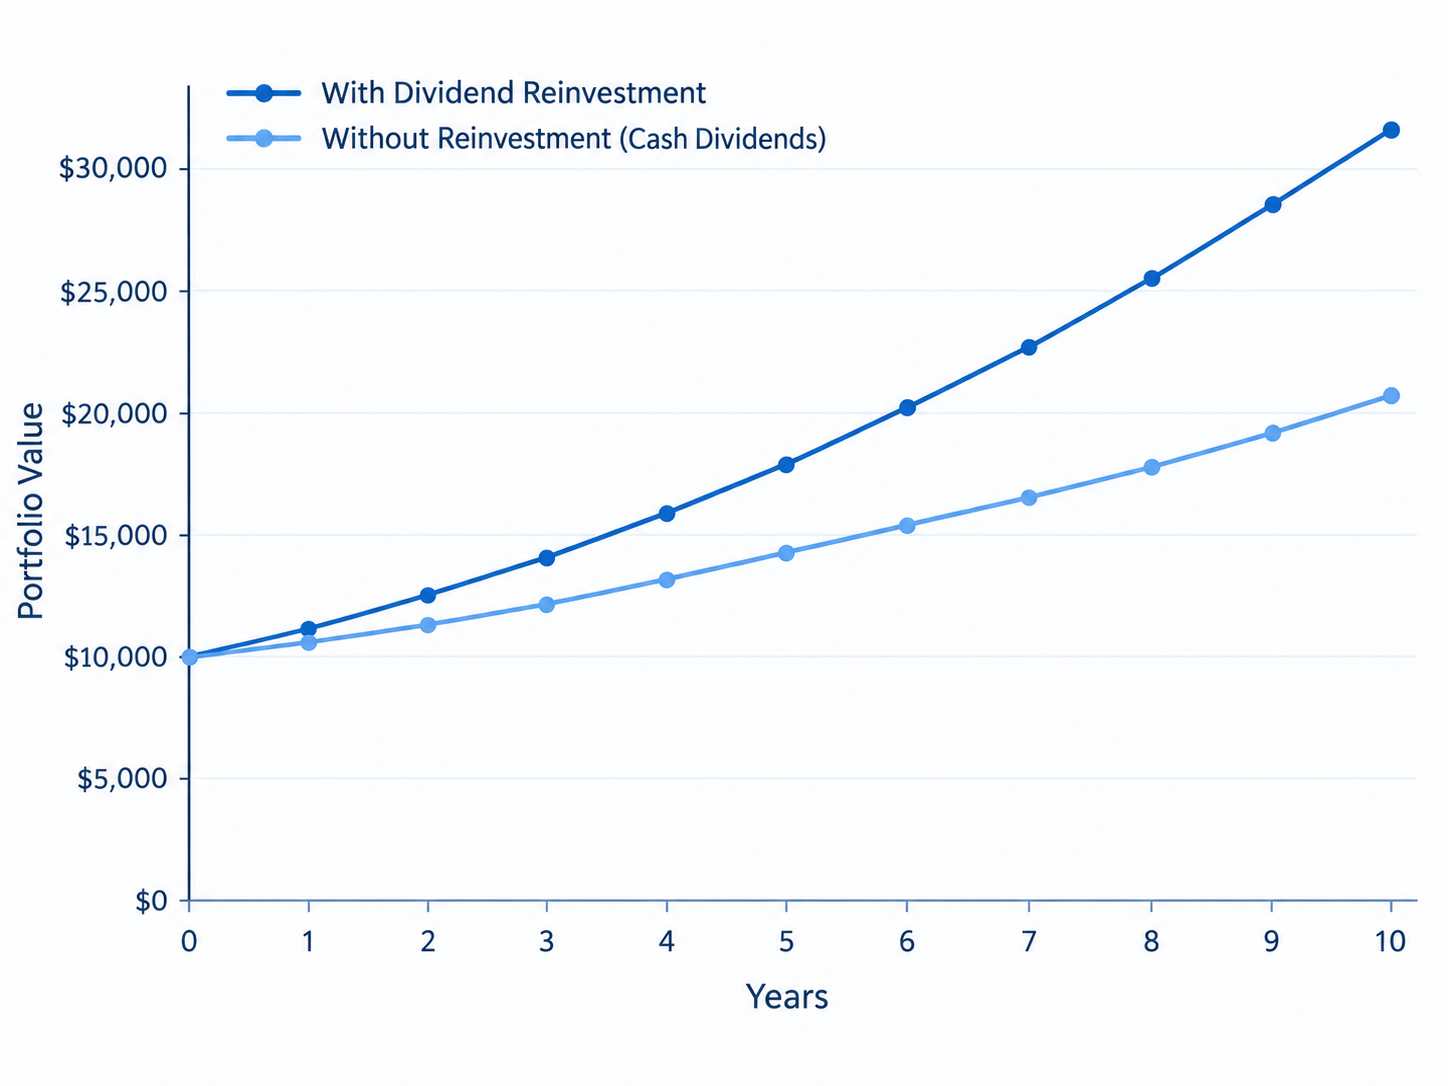
A dividend reinvestment plan automatically uses cash payouts to purchase additional shares instead of depositing cash into your brokerage account. This process, often called DRIP total return, can change your growth trajectory over time significantly.
The core advantage lies in compounding dividends, where reinvested payouts generate their own future dividends and price gains. Comparing reinvested vs cash dividends shows how quickly small differences can accumulate into substantial wealth over decades.
Looking at DRIP vs no DRIP scenarios side by side highlights the compounding effect clearly. Consistent share accumulation through reinvestment steadily increases your total position size, even without contributing any additional money of your own.
This reinvestment growth pattern becomes especially powerful during long-term compounding periods spanning many years of ownership. A simple DRIP calculator example often demonstrates how modest starting amounts can grow much larger through consistent dividend reinvestment.
Ultimately, dividend compounding plays a central role in strategies built around wealth building dividends over time. Choosing to reinvest dividends automatically captures the full total return with reinvestment, maximizing long-term compounding income growth benefits fully.
Worked Examples: Calculating Total Return Step by Step
Seeing a total return example worked out step by step helps clarify how the formula applies in real situations. Numbers communicate concepts more clearly than abstract explanations, especially when following a complete work calculation.
Each sample investment scenario below uses simplified numbers to keep the calculation walkthrough easy to follow along. These examples cover a stock example with dividends, a bond example, and a longer multi-year holding period scenario.
Some examples also include a negative total return example, showing how losses factor into the formula. Reviewing both positive and negative returns side by side builds a more complete understanding of how total return behaves.
Throughout these sections, we walk through the math step by step using realistic example numbers rather than theoretical figures. This practical example approach mirrors how you would apply the calculator to your own actual holdings.
Each scenario also notes the relevant example with holding period details, since timing affects how figures are interpreted. These illustrative calculation exercises prepare you to review your own sample results with greater confidence and clarity.
Example 1: Stock With Dividends (Positive Return)
In this stock example, an investor buys shares at one buy price and later sells at a higher sell price months afterward. Along the way, the position paid modest quarterly dividends into the brokerage account.
Adding the capital gain example from the price difference to the dividend income example collected produces the full per share calculation. This combined figure represents the complete economic benefit generated by this realistic stock scenario.
Using these sample stock numbers, dividing total gain by the original purchase price produces the final total return result as a clean percentage. This positive total return exceeds what price movement alone suggested to investors.
Example 2: Investment With a Price Loss Offset by Income
This scenario examines a negative capital gain, where the share price fell below the original purchase price over the holding period. Despite this price decline example, the position continued paying steady dividend income throughout ownership.
Here, income offsetting loss becomes the key concept, since collected dividends partially cushion the price decline. This dividend cushioning loss effect can sometimes produce a net positive return despite loss in the underlying share price.
Combining the loss and income combined figures shows how this downside scenario avoided a total loss for the investor. This realistic loss scenario demonstrates why total return, not price alone, tells the complete performance story.
Example 3: Multi-Year Holding Period With Annualized Conversion
This multi-year example follows an investment held across several years, requiring converting to annualized return for a fair comparison. Because gains build up gradually, this long holding period benefits from examining compounding over years carefully.
Applying the annualized conversion formula to this multi-year total return figure produces a smoother yearly growth rate overall. This example with a CAGR approach makes it easier to compare against other long-term investment example opportunities fairly.
After completing the years held calculation, the annualized result reveals a steady yearly growth rate rather than one single lump total figure. This final step ties together every concept covered throughout the previous worked examples.
Benchmarking Your Total Return: What Counts as a "Good" Return
Benchmarking returns helps investors judge whether their results were genuinely strong or simply average for the broader market environment. Without a proper comparison point, a seemingly impressive percentage gain can be difficult to interpret meaningfully.
A common approach uses an S&P 500 comparison as a general reference point for broad stock market performance. This benchmark index offers a widely recognized standard, though it may not suit every type of investment.
Defining a good total return percentage depends heavily on context, since realistic return expectations vary across asset classes and time periods. Comparing your results against relevant historical average stock market return data provides useful context.
Appropriate benchmark selection matters greatly, since comparing a bond portfolio directly against a stock index produces misleading conclusions overall. Effective benchmark selection should match the asset type, risk level, and overall investment strategy being evaluated.
Beyond raw numbers, risk-adjusted comparison and relative performance analysis offer deeper insight than a simple percentage figure alone would. True performance evaluation considers whether returns were achieved through excessive risk or genuine, prudent decision-making instead.
Common Mistakes When Calculating Total Return
Several common calculation mistakes can quietly distort your total return figures, sometimes producing dramatically inaccurate final results. Recognizing these calculation pitfalls early on helps ensure your performance analysis remains reliable and genuinely useful over time.
One frequent error involves ignoring reinvested dividends, which understates how much an investment actually contributed to overall portfolio growth. This oversight often leads to misleading return figures that fail to reflect true underlying performance accurately.
Mixing nominal and real returns creates confusion when comparing figures calculated using inconsistent inflation assumptions from different periods. Similarly, using simple averages instead of compounding distorts multi-year results, since compounding behaves differently from simple averages.
Investors sometimes apply the wrong cost basis, especially after forgetting stock splits that changed share counts over time. This produces incomplete income data and skews calculations, leading to figures that misrepresent actual investment performance significantly.
Other common errors include overlooking transaction costs, using an incorrect holding period, or double counting dividends already reflected in price. An inaccurate benchmark comparison compounds these issues further, undermining confidence in the final reported results.
Taxes and Fees: Pre-Tax vs. After-Tax Total Return
Comparing pre-tax vs after-tax figures reveals how much of your reported gain you actually keep after obligations are settled. Many investors focus only on gross numbers, overlooking how taxes meaningfully reduce real, spendable investment performance.
Capital gains tax impact varies depending on how long you held the investment before selling it for a profit overall. Understanding short-term vs long-term capital gains rules helps explain why holding periods affect after-tax outcomes.
Dividend tax treatment also differs depending on classification, since qualified dividends tax rates often differ from ordinary income tax rates. This distinction affects your after-tax return, particularly within a taxable brokerage account setting here today.
Beyond taxes, expense ratio drag and ongoing transaction fees quietly reduce returns over time, even when performance looks strong on paper. This combined fee impact on returns becomes more noticeable across longer holding periods overall.
Using tax-advantaged accounts instead of a standard taxable account can meaningfully improve your net of fees return over time. Calculating a tax-adjusted total return gives a more honest, real-world net return picture for comparison purposes.