
Ultimate Investment Analysis Methods Guide
Introduction
Investment analysis sits at the heart of every informed financial decision whether you're evaluating equities, fixed income, or alternatives. At its core, it is a structured evaluation of a financial asset to determine its intrinsic value, expected return, and associated risk. Having spent years working alongside portfolio managers and equity research analysts, I've seen firsthand how this discipline separates disciplined capital allocation from guesswork. Without it, even experienced investors struggle to distinguish price from genuine asset worth.
What makes this field genuinely compelling is how it bridges numbers with judgment. The process typically involves the need to collect data, model cash flows, quantify risk, and ultimately compare value against current conditions. Professionals spanning investment banking, corporate finance, and private equity rely on these foundations daily from pricing acquisition targets to building DCF models for buyout targets or LBO scenarios. The goal, always, is sharpening risk-adjusted return while managing volatility, downside, and uncertainty across diverse asset classes.
What Is Investment Analysis?
At its core, investment analysis is the disciplined process of evaluating financial assets to determine their intrinsic value, risk, and expected return transforming raw market data into analytics-based decisions. Whether you're assessing stocks, bonds, or entire mutual funds, the goal remains consistent: replace speculation and market hype with structured, proven frameworks that reveal whether an asset is worth buying, holding, or selling. In my experience working through volatile cycles, this discipline separates genuine wealth-builders from gamblers chasing momentum.
What makes investment analysis indispensable across individual investing, asset management, and corporate finance is its capacity to simultaneously measure profitability, understand complexities within financial markets, and build a robust toolkit for navigating uncertainty. Professional analysts rely on methods like DCF valuation and the Capital Asset Pricing Model to validate every position within a portfolio, ensuring each decision serves long-term returns while minimizing risks and maximizing returns for both novice investors and seasoned professionals operating under real-world constraints.
Who Uses Investment Analysis?
Investment analysis sits at the heart of nearly every serious buy, hold, or sell decision made across equity research, portfolio management, and corporate finance. In my experience working through complex financial assets, the professionals relying most heavily on this discipline include professional analysts, hedge fund managers, and institutional investors who routinely apply DCF models, CAPM, and financial statement scrutiny to evaluate intrinsic value against market price. Each brings a different lens but shares the same core goal: informed decisions that minimize risks while maximizing returns.
Beyond institutional walls, individual investing has expanded the user base dramatically. Robot-advisors like Betterment and Wealth front now democratize access to tools once reserved for investment banks and equity research desks. Asset management firms, private equity professionals evaluating leveraged buyouts, and corporate development teams assessing capital budgeting and project ROI all depend on disciplined analysis. Even FP&A teams within corporations use these frameworks when forecasting revenues, structuring derivatives, or determining merger pricing making investment analysis genuinely universal.
Types / Methods of Investment Analysis
Fundamental Analysis
Fundamental analysis begins by examining a company's financial statements, balance sheets, income statements, and cash flow statements to uncover true business value. Professional equity research teams dig into liquidity, solvency, and free cash flows, applying Discounted Cash Flow models to estimate present value and spot undervalued assets. From my own experience, this method rewards patience: numbers rarely lie, but context does. Analysts ultimately issue hold or sell recommendations based on a comprehensive view rather than fleeting market price swings.
Technical Analysis
Technical analysis shifts focus to statistical trends in trading activity and volume, reading chart patterns like head and shoulders or double top formations to anticipate reversals. Traders rely on technical indicators such as Bollinger Bands to pinpoint buy/sell points, tracking momentum and overall trend direction. Having charted countless sessions myself, I've learned that price action often whispers before fundamentals shout. This approach treats every price move as a clue, prioritizing market price behavior over balance-sheet depth.
Quantitative Analysis
Quantitative analysis leans on mathematical models and statistical models powered by computational algorithms, the realm where quants turn numerical data and statistical data into actionable signals. By crunching measurable data, facts, and patterns, analysts run computations to project future performance using concrete data. In my experience, this method excels when you need to compare and benchmark opportunities against standard methods and historical data, demanding sophisticated, mathematical, and statistical knowledge throughout the process.
Qualitative Analysis
Qualitative analysis steps away from spreadsheets to weigh the intangible aspects that numbers can't capture: a company's track record, reputation, business model, and standing within its competitive sector. Analysts assess market position, brand strength, and industry trends to judge whether products resonate with customers and leadership executes well. I've found this perspective invaluable for catching risks spreadsheets miss entirely. Together with quantitative rigor, qualitative analysis rounds out a holistic, balanced investment perspective.
The Three Pillars of Investment Analysis
Valuation Finding What Something Is Actually Worth
Every seasoned analyst knows that valuation sits at the heart of every buy, hold, or sell decision. Through methods like Discounted Cash Flow (DCF) analysis and comparable company analysis, professionals estimate the intrinsic value of a company against its market price. When market value falls below intrinsic value, an asset is considered undervalued, a signal worth acting on. Incorporating earnings per share (EPS), P/E ratios, and EV/EBITDA multiples sharpens valuation precision considerably.
Risk Understanding What Could Go Wrong
Risk is not something to fear, it is something to measure. Drawing from CAPM, beta, and Value at Risk (VaR), analysts assess potential losses across asset classes and portfolios. Scenario analysis and stress testing reveal vulnerabilities under extreme market conditions, while Monte Carlo Simulation maps the full probability distribution of investment outcomes. In my experience, ignoring systematic risk or market volatility has consistently led even disciplined teams toward suboptimal decisions they later struggled to justify.
Return Measuring the Reward Against the Cost
Return analysis answers one fundamental question: is this investment worth the risk taken? Using ROE, ROIC, WACC, and Sharpe ratio, analysts evaluate risk-adjusted return against industry benchmarks. Free Cash Flow (FCF) reveals whether revenues genuinely convert into financial health or merely reflect accounting illusions. Dividends, share buybacks, and the ability to reinvest profits signal long-term capital efficiency. Profitability only means something meaningful when viewed through the lens of cost of capital and true shareholder value creation.
Key Metrics in Investment Analysis
Earnings Per Share (EPS)
Among the most fundamental indicators every analyst revisits repeatedly, earnings per share measures how much net income a company generates per outstanding share, essentially distilling profitability into a single, comparable figure. When I first started reviewing financial statements, EPS felt deceptively simple yet it anchors nearly every serious equity research conversation. Tracking revenue growth alongside EPS reveals whether earnings reflect genuine operational strength or temporary accounting shifts. Without understanding EPS, evaluating future projections or past performance becomes structurally incomplete.
Price-to-Earnings Ratio (P/E)
The price-to-earnings ratio universally abbreviated as P/E sits at the intersection of market value and earning capacity, telling you precisely what investors currently pay per dollar of earnings. Seasoned analysts use P/E alongside valuation multiples to determine whether a stock appears undervalued or overvalued relative to comparable peers. What makes this metric genuinely powerful is how it contextualizes market sentiment within relative valuation frameworks. Ignoring industry benchmarks while interpreting P/E independently often leads to misguided buy or sell recommendations a mistake even experienced professionals occasionally make.
Return on Equity (ROE)
Return on equity measures how efficiently management converts shareholders equity into profits, making it indispensable when assessing genuine value creation. High ROE sustained over time typically signals strong competitive advantage and disciplined cost management, two qualities that separate durable businesses from cyclical performers. During financial analysis, comparing ROE against the cost of capital reveals whether a company genuinely exceeds its WACC or quietly destroys value despite reporting positive accounting profits. This connection between ROE and shareholder value is something experienced portfolio managers understand intuitively.
Debt-to-Equity Ratio (D/E)
The debt-to-equity ratio quantifies financial leverage by comparing total long-term debt against shareholders equity, immediately signaling how aggressively a business funds growth through financing strategies. Companies carrying disproportionate debt relative to equity face heightened solvency concerns, particularly during periods of rising interest rates or tightening credit markets. In my experience analyzing balance sheets, a deteriorating D/E ratio frequently precedes liquidity stress even when income statements still report healthy revenues. Monitoring short-term obligations alongside this metric provides a more complete picture of genuine financial health.
Enterprise Value-to-EBITDA (EV/EBITDA)
Enterprise Value-to-EBITDA commonly expressed as EV/EBITDA has become the preferred valuation multiple among investment banks and equity research analysts precisely because it neutralizes differences in financial obligations, capital structure, and tax treatment across companies. Unlike P/E, this metric captures total enterprise value relative to operational earnings before interest and taxes, making M&A deals and IPO valuations considerably more accurate. When screening publicly traded businesses within a defined peer group, EV/EBITDA anchors comparable company analysis far more reliably than surface-level price metrics alone
Free Cash Flow (FCF)
Sophisticated analysts increasingly prioritize free cash flow over reported net income because FCF reflects actual cash generation after capex stripping away accounting metrics that can obscure true operational performance. The DCF model fundamentally depends on reliable FCF projections, translating expected future cash flows into present value through appropriate discount rate assumptions. In capital-intensive industries like manufacturing or real estate, unlevered free cash flow matters enormously; it exposes whether revenues genuinely translate into distributable cash inflows or simply mask growing working capital burdens that erode long-term financial flexibility.
Net Present Value (NPV)
Net Present Value transforms abstract future cash flows into concrete, comparable figures by discounting them against a required rate of return, making capital budgeting decisions structurally rigorous rather than intuitive. A positive NPV signals that projected cash inflows exceed cash outflows including the initial investment, confirming genuine profitability potential. Conversely, a negative NPV triggers immediate reassessment of underlying revenue forecasts and growth assumptions. Experienced management consulting professionals routinely build base case, best case, and worst case scenarios around NPV outputs, ensuring stress-tested conclusions that withstand real-world competitive dynamics.
Internal Rate of Return (IRR)
Internal Rate of Return identifies the precise discount rate at which a project's NPV reaches exactly break-even, effectively revealing the inherent return embedded within any investment's projected cash flows. When IRR comfortably exceeds WACC, the investment clears the fundamental cost of capital threshold, justifying commitment. Private equity analysts rely heavily on IRR alongside sensitivity analysis when evaluating long-term assets in volatile environments, including oil and gas and R&D-intensive sectors. Incorporating risk-adjusted discount rates, salvage value, and tax implications ensures IRR calculations remain genuinely decision-grade rather than superficially optimistic.
Role Of Financial Statements
Every credible investment thesis begins with the financial statements, the income statement, balance sheet, and cash flow statement because numbers reveal what narratives often hide. I have learned that reading these three together tells a fuller story than any single document alone. The income statement shows earnings momentum, the balance sheet exposes liabilities measured against assets, and the cash flow statement confirms whether reported profitability truly converts into real cash generated from operations. Skipping even one invites costly blind spots.
From these raw figures, analysts derive ratios that translate data into judgment: Return on Equity measures how efficiently capital generates profit for shareholder equity, while the Debt-to-Equity ratio captures financial leverage and exposure to total debt against total equity. The current ratio, comparing current assets to current liabilities, signals short-term liquidity, and broader solvency checks confirm lasting financial health. Benchmarking these figures against peers turns isolated numbers into meaningful performance context.
Advanced Valuation Methods
Picking apart a company's worth gets serious once you move beyond surface numbers. In my own practice, NPV Analysis earns its keep because it reduces a tangled set of future cash flows into one absolute dollar value, supporting capital budgeting through a clear decision rule rooted in time value. Pair that with relative valuation, where market multiples stack a business against its peers for a quick, market-reflective read. Together they balance intrinsic value with fundamental-based judgment, useful when hunting undervalued assets across uneven timeframes.
Where things get sophisticated is Monte Carlo work feeding probability distributions through thousands of outcomes demands real computational resources, but the payoff is a comprehensive risk view built around key sensitivities rather than guesswork. I often layer in Economic Value Added (EVA) for performance measurement, since it quantifies whether a business is truly earning above its cost of capital, and it aligns incentives for management incentives tied to genuine long-term value investing outcomes in M&A scenarios.
Modern Portfolio Theory (MPT)
I've come to appreciate Modern Portfolio Theory as a lens that shifts attention away from any single stock and toward how holdings behave together. Rather than judging an asset purely on its own expected return, MPT asks what contribution it makes to portfolio-level risk. When individual asset returns show low correlation, combining them can lower total portfolio risk without sacrificing return, a principle I've watched reshape how clients think about building resilient portfolios over time.
In practice, I lean on the efficient frontier to visualize where risk and reward strike their best balance, and I track the Sharpe ratio to judge whether risk-adjusted return justifies a given position. Standard deviation remains my go-to gauge for volatility within diversification strategies. Aligning diversification goals with personal risk tolerance helps portfolios absorb unexpected market shifts more gracefully, something textbook formulas alone rarely communicate as clearly as lived market experience does.
Risk Assessment Techniques
Identifying and Measuring Investment Risk
Effective risk analysis begins long before any capital is committed. Seasoned analysts examine market volatility, inflation, and interest rate fluctuations to gauge potential exposure across an investment. Rather than treating risk as a single number, experienced practitioners disaggregate it separating systematic risk from company-specific vulnerabilities. Beta serves as a cornerstone metric here, quantifying a stock's sensitivity to market movements and helping analysts benchmark volatility against broader market returns with measurable precision.
What many overlook is that raw numbers never tell the complete story. Regulatory changes, political uncertainty, and sovereign risk particularly in emerging market environments introduce dimensions that spreadsheets rarely capture cleanly. A robust framework incorporates country risk premium (CRP) adjustments alongside currency risk evaluations, especially when comparing developed market opportunities. In my experience reviewing cross-border valuations, ignoring qualitative non-financial risks like potential lawsuits consistently produces dangerously incomplete risk assessment outputs.
Quantifying Risk Through Models and Frameworks
The Capital Asset Pricing Model remains the practitioner's workhorse for translating risk into expected return. Its elegant formula Expected Return equals Risk-Free Rate plus Beta multiplied by the Equity Risk Premium connects market risk to cost of equity in DCF-driven workflows. As with Damodaran of NYU Stern has extensively documented how historical ERP for US equities typically ranges between 4% and 6% over long periods, giving analysts an empirical anchor when estimating WACC and running DCF valuation models with defensible discount rate assumptions.
Stress-testing assumptions matters equally. Sensitivity analysis adjusting terminal growth rate, WACC, or revenue growth rate reveals how dramatically intrinsic value shifts with modest input changes. Analysts using only single-scenario DCF outputs routinely underestimate this exposure. Incorporating Monte Carlo simulations alongside scenario analysis mapping bull, base, and bear cases transforms static valuation into a dynamic range of potential outcomes, giving portfolio managers genuine conviction rather than false precision.
Measuring Risk: CAPM, Beta, and the Equity Risk Premium
Understanding Systematic Risk Through Beta
Every seasoned analyst I've worked alongside eventually arrives at the same realization: not all risk is created equal. Beta isolates systematic risk, the portion no amount of diversification can eliminate. A stock with a beta of 1.5 swings harder than the market in both directions, amplifying price movements during volatility. Unlike company-specific exposure, systematic risk is priced into expected return calculations across portfolios. Understanding beta before building any financial model separates disciplined practitioners from those simply guessing at stock returns.
How CAPM Translates Risk into Return Expectations
The Capital Asset Pricing Model gave analysts a structured way to ask: what return does this risk deserve? Its formula connects the risk-free rate, typically government bonds with the Equity Risk Premium multiplied by Beta. Written precisely: Expected Return equals Risk-Free Rate plus Beta times the market risk premium. This elegant relationship powers DCF valuation as the primary cost of equity input. Professionals across equity research and portfolio management rely on CAPM to discipline assumptions and anchor investment decisions against measurable benchmarks.
The Equity Risk Premium and Why It Matters
The equity risk premium represents compensation investors demand for choosing equities over safer risk-free assets. It's the return gap between stocks and government bonds historically meaningful for US equities but one that fluctuates with market conditions. Within WACC calculations and DCF valuations, the ERP functions as a critical calibration lever. Underestimate it and your intrinsic value inflates dangerously. In my own modeling experience, using a stale ERP from outdated assumptions quietly distorts every downstream valuation figure that follows.
Applying CAPM Within a Broader Analytical Context
CAPM doesn't operate in isolation; it feeds directly into DCF valuation and shapes portfolio-level decisions through Modern Portfolio Theory. Analysts also reference Arbitrage Pricing Theory, which incorporates multiple macroeconomic variables and systematic risk factors beyond a single beta measure. Together, these frameworks extend how professionals assess risk and expected return across complex holdings. The efficient frontier and Sharpe ratio further contextualize whether additional risk is genuinely compensated, giving both investment analysts and portfolio managers richer tools for risk-adjusted return evaluation.
Time Value of Money: The Foundation of All Valuation
Every dollar earned tomorrow is worth less than a dollar in hand today, and this simple truth anchors nearly every valuation exercise an analyst performs. When I first built a DCF model early in my career, what struck me wasn't the math but the philosophy: future cash flows must be discounted back to present value because money carries opportunity cost. The discount rate assumption, often tied to WACC, becomes the single most consequential lever separating a sound intrinsic value estimate from a speculative guess.
Beyond the core DCF mechanics, tools like Net Present Value, NPV, and Internal Rate of Return, IRR, extend this logic into capital budgeting and project ROI decisions, while the Gordon Growth Model, GGM, simplifies things for dividend-paying, mature companies using a constant rate assumption. Even terminal value calculations in a DCF valuation rest entirely on this principle. Mastering time value isn't academic, it's the lens through which expected future earnings, financial obligations, and required rate of return all converge into one coherent number.
Behavioral Finance In Investment
Behavioral finance examines how human emotion quietly distorts what should be rational decision-making. Traders often fall victim to anchoring, fixating on a stock's recent price rather than its true worth, while market sentiment sweeps entire crowds toward overly optimistic conclusions. I've personally watched conviction crumble the moment a bullish trend reverses, proving that intuition alone cannot replace discipline. Markets eventually experience reversion to the mean, punishing those who mistook noise for signal. Understanding these psychological traps is what separates informed financial decisions from pure guesswork.
Qualitative factors like investor psychology remain stubbornly subjective and time-consuming to quantify, yet ignoring them is reckless. I rely on historical price action and price momentum to validate whether a stock genuinely sits undervalued or whether crowd enthusiasm has pushed it overvalued. Confidence should follow evidence, not precede it; an investment thesis built on borrowed conviction rarely survives volatility. Aligning analysis with personal risk tolerance, mastering emotional refinement, and resisting herd behavior ultimately becomes its own quiet competitive advantage in unpredictable markets.
Components Of Investment Analysis
Every credible investment analysis begins with understanding the underlying business, not just its numbers. Years of reviewing portfolios taught me that intrinsic value rarely shows up on a spreadsheet alone; it emerges from studying competitive position, leadership, and how a company actually earns money. The income statement, balance sheet, and cash flow statement form the factual backbone, revealing profitability, liquidity, and solvency trends that separate durable enterprises from fragile ones dressed up by short-term results.
Beyond the raw figures, a complete picture blends quantitative analysis with qualitative analysis to judge what numbers alone cannot capture. I weigh management quality, competitive moats, brand recognition, and intellectual property alongside regulatory risk, since these intangibles often decide whether financial health holds up under pressure. Translating free cash flows into present value, applying valuation multiples, and weighing expected return against risk completes the framework, turning scattered data into a coherent, decision-ready assessment of any opportunity.
Quantitative vs. Qualitative Investment Analysis
When I first started comparing mathematical models against gut-level judgment calls, the divide between quantitative analysis and qualitative analysis became obvious fast. Quantitative factors rely on numerical data, computational techniques, and statistical knowledge to produce concrete, measurable data that's easy to compare and benchmark against standard methods. Meanwhile, qualitative assessment digs into business model strength, management quality, and competitive moats, things no spreadsheet alone captures. Both approaches feed investment decisions, but they answer fundamentally different questions about a company's worth.
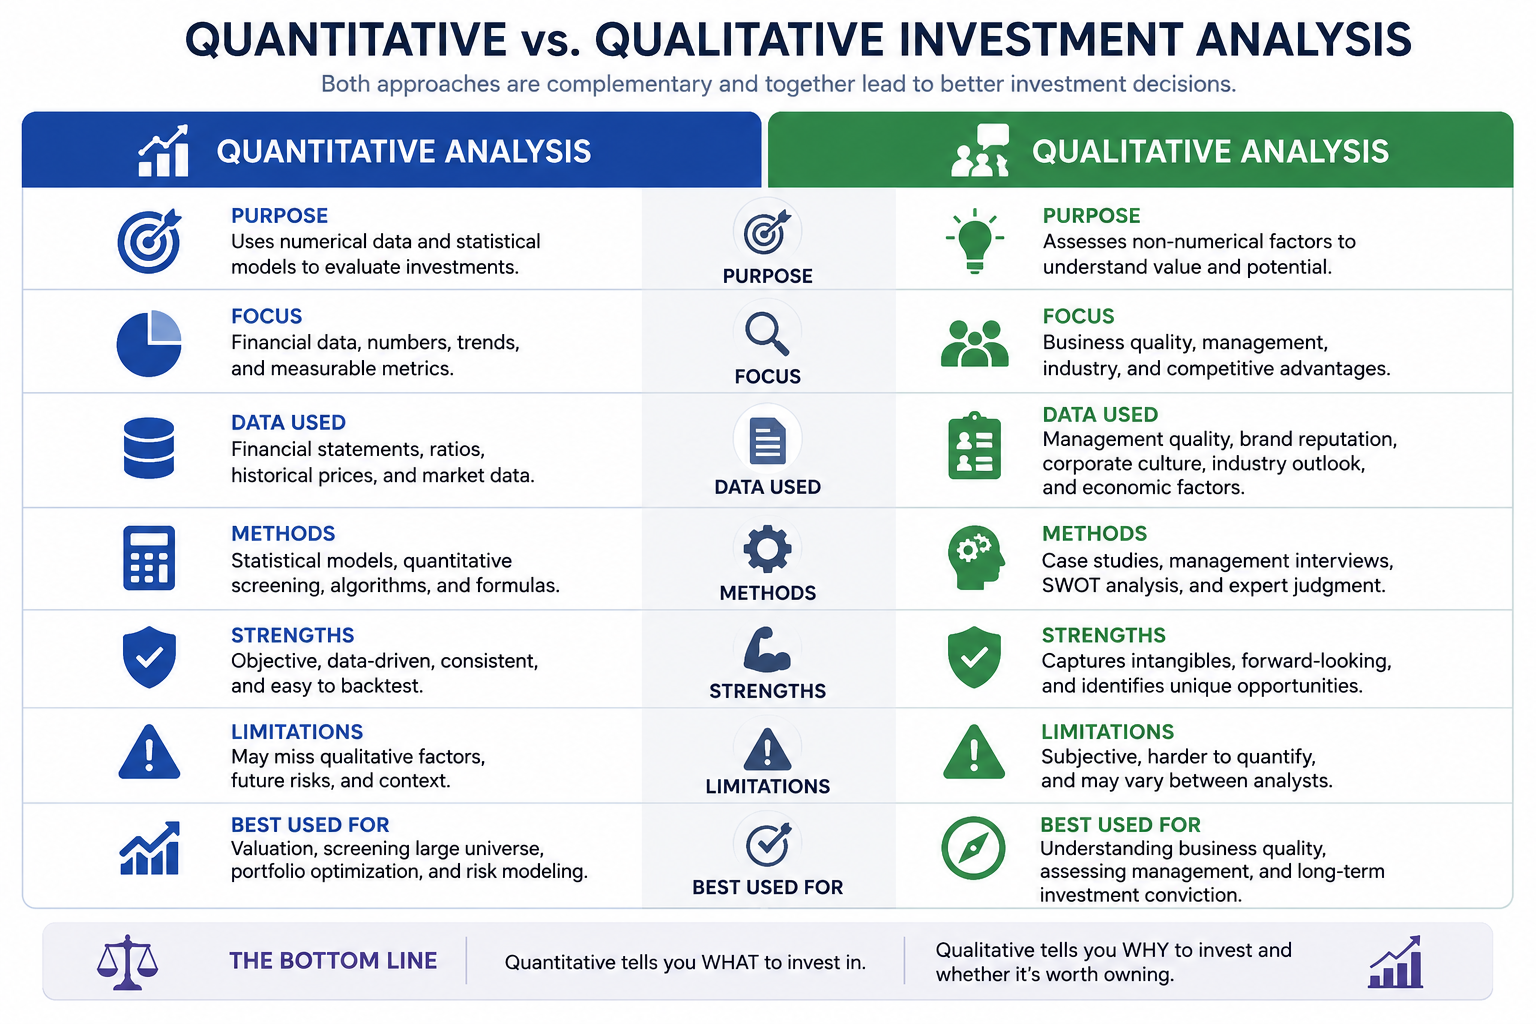
In practice, I've learned that leaning solely on sophisticated, mathematical outputs like valuation multiples or historical data can miss non-financial risks such as regulatory changes and pending lawsuits. Qualitative factors including brand recognition, intellectual property, and board of directors strength reveal economic factors that standardized, numerical measures overlook. The strongest investment analysis blends both: quantitative approaches validate the numbers while qualitative research explains the story behind them, giving professional analysts a genuinely comprehensive view before committing capital.
Modern Investment Analytics: Driving Decisions With Data
In my years tracking portfolios, the shift toward data analysis tools has reshaped how professionals operate. Rather than relying purely on instinct, investment professionals now lean on computational algorithms and statistical models to interpret massive volumes of market data. These systems don't replace judgment, they sharpen it, surfacing patterns humans might overlook. I've seen firms optimize entire workflows by layering technology atop traditional research, ultimately aiming to predict shifting market trends before they fully materialize, giving teams a measurable edge in competitive conditions.
What excites me most is how machine learning and AI have moved from buzzwords into practical tools that genuinely support decision-making. They digest historical and live data simultaneously, refining outputs as conditions evolve. This isn't about chasing novelty, it's about producing informed decisions faster and with greater consistency. The result is often personalized guidance tailored to specific goals, alongside more efficient service delivery, and ultimately stronger portfolio performance for clients who demand both precision and adaptability in today's markets.
Step-by-Step Investment Analysis Framework
Build a framework starting with raw data and moving toward actionable intelligence. Begin by examining financial statements, the balance sheet, income statement, and cash flow statement to gauge financial health and profitability. Layer in fundamental analysis tools like Price/Earnings and Return on Equity, then compare against peers through Comparable Company Analysis. From my own workflow, I've found that anchoring early steps in measurable facts prevents emotional decisions later, turning scattered numbers into a comprehensive perspective before any buy or sell recommendation is made.
Next, blend technical analysis with quantitative analysis to validate timing signals. Study chart patterns, moving averages, and Relative Strength Index alongside economic indicators like GDP growth and inflation rates to capture market-context decisions. Stress-test assumptions using sensitivity tables and discount rate assumptions, then apply risk management practices to back test the strategy against historical data. This adaptable workflow, much like a detective gathering evidence, transforms isolated indicators into a repeatable, data-driven process that supports smarter, evidence-based investment decisions consistently.
Investment Analysis Tools and Techniques
Building a reliable toolkit starts with Excel, where analysts construct financial models, run comparable, and stress-test assumptions against market consensus. I've found that pairing a 3-statement model with financial ratios sharpens judgment far more than relying on a single output. Fundamental analysis digs into balance sheet, income statement, and cash flow statement data, while valuation multiples like P/E and EV/EBITDA offer quick sanity checks against peers. These mechanics, though technical, only matter when paired with disciplined investment judgments rather than blind spreadsheet construction.
On the other side, technical analysis tools moving averages, RSI, and Bollinger Bands help time exit points using charts and historical price movements. Quantitative analysis brings statistical models, algorithms, and correlations into the mix, useful for spotting market inefficiencies few notice. In my own workflow, combining DCF valuation with CAPM for discount rates, then validating against trading strategies and technical indicators, produces a sturdier analytical toolkit than leaning on any one method alone, each tool catching what another misses.
Investment Analysis vs. Financial Modeling
Investment analysis and financial modeling often get treated as interchangeable, but my experience building both reveals a sharp distinction. Investment analysis asks whether an asset deserves capital, weighing fundamental analysis, competitive positioning, and intrinsic worth against current stock price. Financial modeling, by contrast, is the mechanical engine: a financial model projecting revenue forecasts, margins, capex, and working capital across years. One judges value; the other simulates numbers. Analysts who confuse the two often produce polished spreadsheets with weak conclusions, mistaking precision for insight.
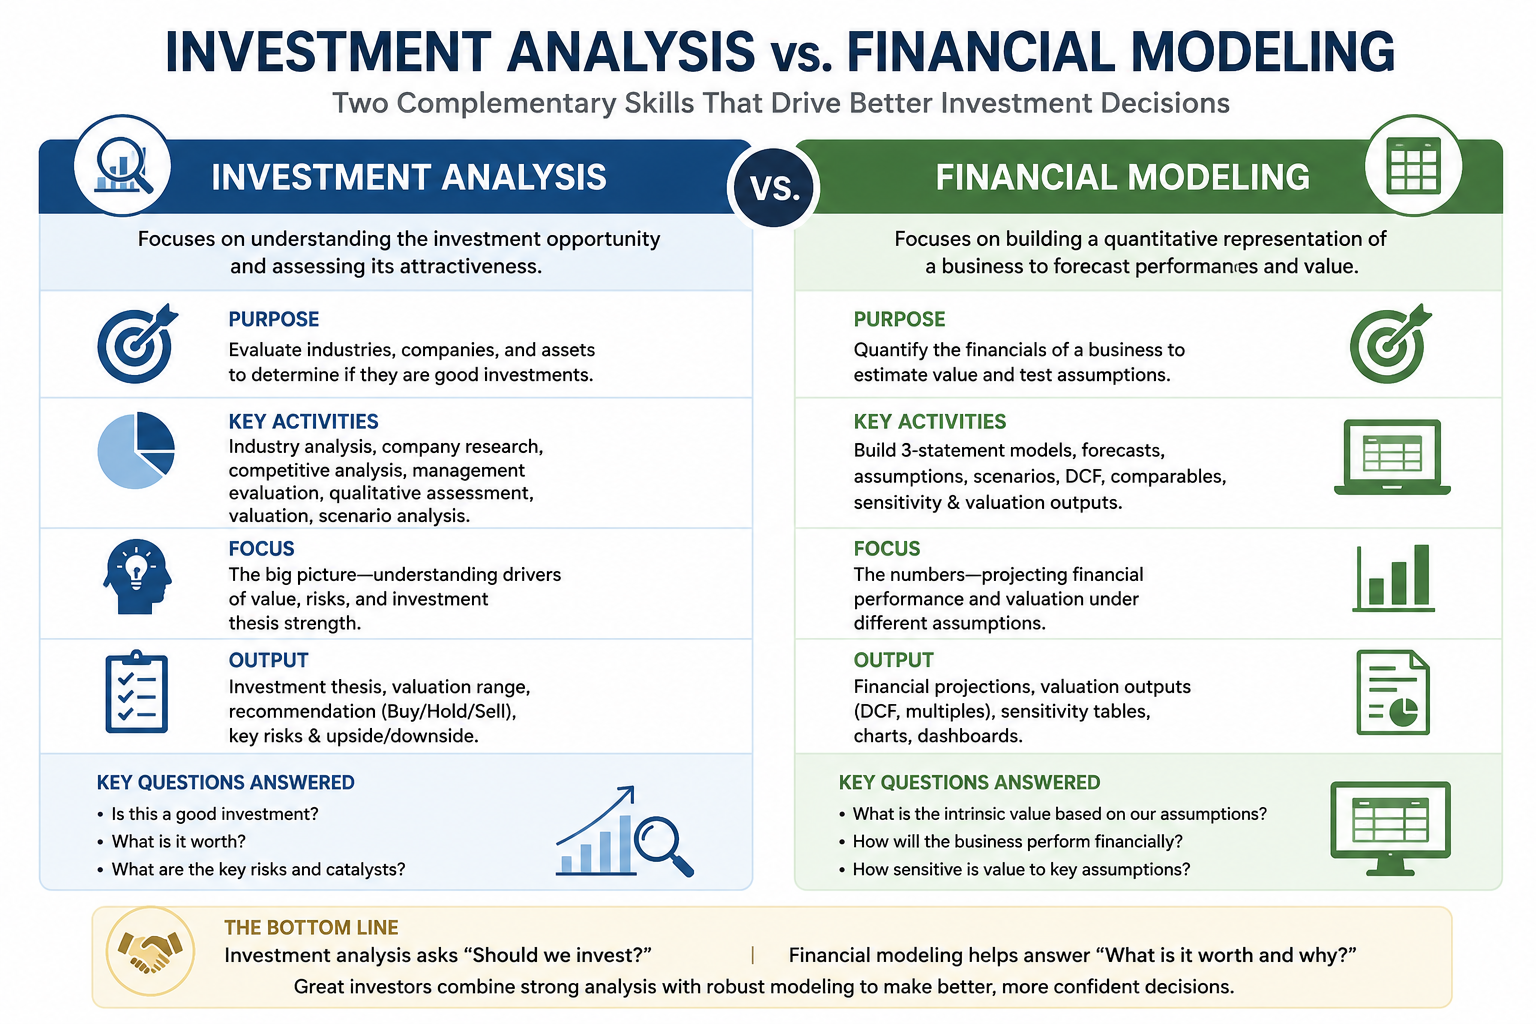
From years spent stress-testing revenue projections, I have learned that comparable company analysis and precedent transaction analysis belong inside financial modeling, while investment analysis decides whether those scenarios justify a margin of safety. A hedge fund manager building a DCF still relies on an investment analyst to question growth rates and avoid valuation mistakes. Even Economic Value Added, derived from NOPAT, means little without judgment grounded in capital budgeting realities, merger pricing context, and a feel for derivatives risk.
Common Investment Analysis Mistakes
One recurring error I've watched investors repeat is letting emotional responses override discipline. Overconfidence convinces people their read on the market is superior, while anchoring to a reference point say, a stock's original purchase price skews judgment long after conditions shift. Loss aversion keeps traders clinging to losing stocks, waiting to break even instead of cutting losses. These cognitive biases aren't signs of poor intelligence; they're predictable patterns that even seasoned analysts fall into when capital and ego intertwine.
Another trap is mistaking speculation for genuine analysis. Chasing price momentum or reacting to sentiment without a fundamental valuation basis often produces irrational decisions dressed up as strategy. Herd behavior during market bubbles feels safe because everyone else is doing it, yet it frequently precedes painful crashes. I've found that sticking to predefined investment rules and a long-term perspective, rather than relying on single-point forecasts or gut timing, helps investors sidestep these psychological pitfalls and avoid suboptimal outcomes.
Integrating Analysis Into Your Investment Workflow
In my own practice, blending fundamental analysis with technical analysis never happens in isolation; it's a layered habit. I start with financial statement analysis, scanning the balance sheet and income statement for signs of financial health, then cross-check valuation multiples like P/E against industry benchmarks. Only after that do I bring in price and volume patterns to time entries. This sequencing turns scattered data points into one coherent investment decision rather than a guess dressed up as analysis.
What ties the workflow together is discipline around risk management and portfolio theory. Before any buy or sell call, I revisit expected return against systematic risk, weigh diversification through Modern Portfolio Theory, and let scenarios stress-test assumptions. Quantitative analysis keeps the numbers honest while qualitative analysis captures competitive positioning and management compensation signals spreadsheets miss. Over time, this fusion of forecasting, judgment, and risk-adjusted return thinking becomes second nature less a checklist, more an instinct sharpened by repetition.