
What Standard Deviation Means in Stock Analysis
Standard deviation is a statistical measure of risk describing how much a stock’s returns move away from their average return. It captures the dispersion of returns around a central point, giving investors a numerical picture of price behavior.
In stock analysis, this number reflects the spread of data in daily, weekly, or monthly price changes. A wider spread signals unpredictable movement, while a tighter spread suggests the stock trades closer to its typical historical pattern.
Standard deviation is closely tied to variance, since it is literally the square root of variance. Variance measures dispersion in squared units, which are hard to interpret, so standard deviation converts that figure back into a usable scale.
Investors often treat standard deviation as shorthand for a volatility measure. It does not predict direction, only magnitude, meaning a stock can have high standard deviation whether it trends upward, downward, or sideways.
Understanding this concept matters because the mean stock price or return alone tells only part of the story. Two stocks can share identical average returns yet behave very differently, and standard deviation reveals that hidden difference in price fluctuation.
How Standard Deviation Is Calculated for a Stock
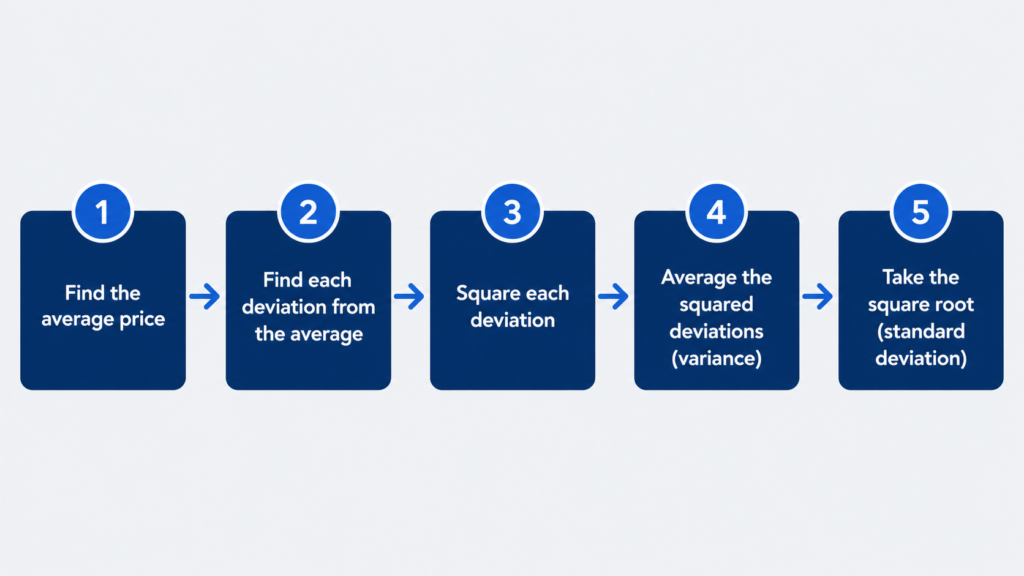
Calculating standard deviation starts with a mean calculation across a chosen set of historical prices or returns. Analysts typically use daily returns rather than raw prices, since returns better represent percentage change and comparability across stocks.
Next comes the variance formula, which sums the squared deviations of each return from the mean. Squaring removes negative signs, ensuring that movements above and below the average both contribute positively to the total dispersion figure.
That sum is then divided by the sample size, adjusted depending on whether the analyst is working with a full data set or a smaller sample. This division produces the variance, the intermediate value used before the final step.
Taking the square root of that variance produces the standard deviation itself. This step returns the measure to the original unit of returns, making it directly comparable to the stock’s typical percentage moves.
Analysts choose between population standard deviation and sample standard deviation depending on the data available. The distinction affects the divisor used in the formula and can slightly change the resulting risk figure.
Worked Example: Calculating Standard Deviation for a Real Stock
Consider a real stock example using ten days of closing prices converted into daily percentage returns. Listing each return creates the foundation for a simple deviation table used in the calculation.
Each daily return is compared against the average return for the period, producing individual deviations. Squaring each deviation and summing the results gives the raw material needed for the variance example calculation.
Dividing that sum by the appropriate sample size and taking the square root produces the final standard deviation value. This step-by-step example shows how raw price data becomes a single, meaningful risk figure.
Population vs. Sample Standard Deviation Which Should You Use?
The choice between population and sample formulas depends on whether the data represents the entire history or only a portion of it. This distinction relates directly to degrees of freedom in the calculation.
The population formula divides by the total count, while the sample formula divides by one less, often written as n vs n-1. This adjustment corrects for bias when working with an incomplete data set.
In spreadsheet tools, this choice appears as STDEV.P for population data and STDEV.S for sample data. Most stock analysis relies on sample formulas, since historical prices rarely represent a complete population.
Calculating Standard Deviation in Excel, Google Sheets, or a Stock Calculator
Most investors calculate standard deviation using an STDEV function built into common spreadsheet software. Entering a column of historical returns and applying the formula produces an instant volatility figure without manual computation.
Both Excel spreadsheet tools and Google Sheets formula options support this calculation natively. Users simply input historical prices, convert them to returns, and reference that range inside the standard deviation function.
For those who prefer not to build spreadsheets, an online finance calculator or automated calculation tool can produce the same output volatility percentage instantly from pasted price data.
Daily vs. Annualized Standard Deviation
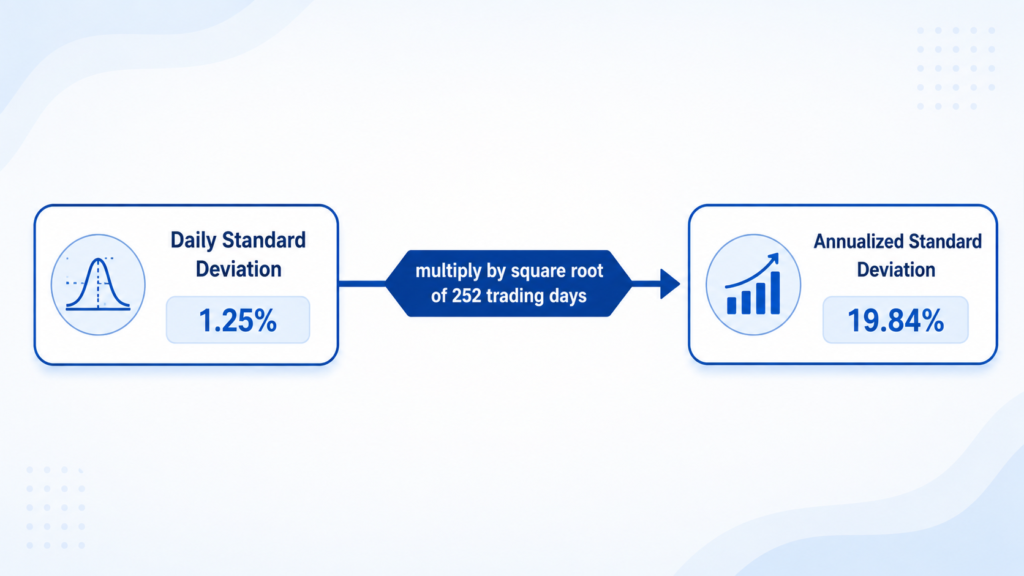
Standard deviation calculated from daily returns produces a daily standard deviation figure, which reflects short-term price swings. This number is useful but difficult to compare across stocks measured over different time frames.
To make figures comparable, analysts convert daily numbers into annualized volatility using the square root of time rule. This approach scales short-term dispersion into a figure that reflects a full year of trading.
The standard convention multiplies daily standard deviation by the square root of 252 trading days, the typical number of active trading sessions in a year. This produces the widely quoted annualized volatility figure.
A similar process applies to weekly standard deviation, using the appropriate number of weekly periods instead of daily ones. Converting timeframes this way keeps volatility measures consistent across different reporting periods.
Annualized figures matter most when investors want comparable volatility figures across multiple stocks or asset classes. Without this conversion, comparing a daily figure to an annual one would produce misleading conclusions.
How to Interpret Standard Deviation as a Risk Signal
A high standard deviation generally points to a volatile stock, one prone to larger and more frequent price swings. This does not automatically mean the stock is a poor choice, only that its path is less predictable.
Conversely, low standard deviation meaning often applies to a blue-chip stock stability profile, where prices move gradually and predictably. Such stocks may appeal more to investors with lower risk tolerance.
Standard deviation treats upside vs downside volatility equally, since it measures distance from the mean in both directions. A stock jumping sharply higher registers the same statistical impact as one falling sharply lower.
Because of this symmetry, standard deviation should never be read in isolation as good or bad. Context, including the stock’s sector and typical trading pattern, shapes what a given figure actually signals.
Investors use this measure as one signal among many, not a final verdict on quality. It helps frame expectations about price behavior rather than dictating any specific investment decision.
What Counts as a “High” or “Low” Standard Deviation
There is no universal threshold defining a typical stock volatility range, since acceptable levels vary widely by industry and company size. What looks high in one context may look ordinary in another.
Sector volatility comparison matters because certain industries, like technology or biotechnology, tend to show naturally wider price swings. Utilities and consumer staples typically display steadier, lower dispersion in daily returns.
Company size also plays a role, since small-cap vs large-cap volatility patterns differ significantly. Comparing a stock’s standard deviation against the S&P 500 average standard deviation offers a useful benchmark comparison for context.
The Normal Distribution Assumption and the 68-95-99.7 Rule
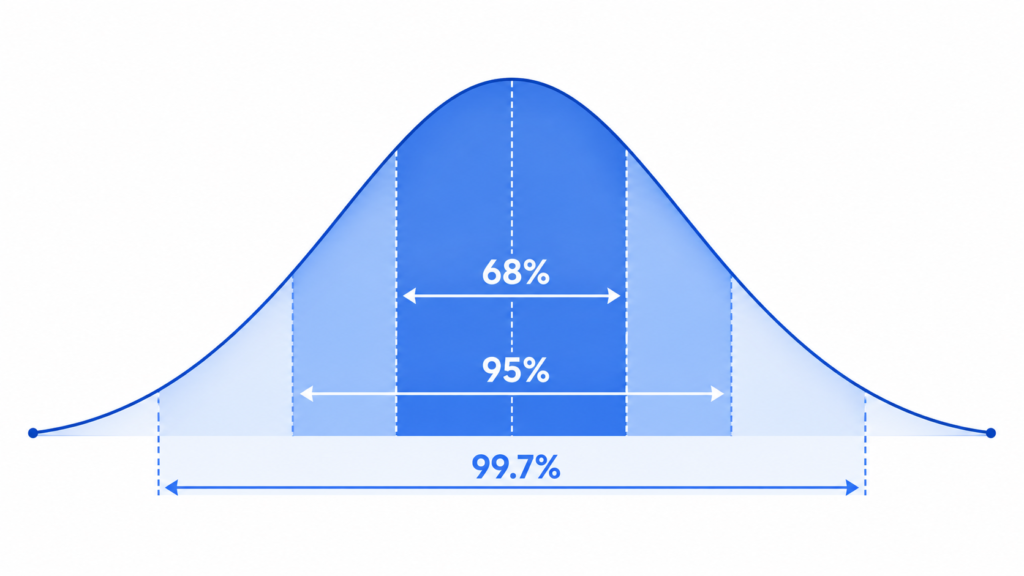
Many standard deviation calculations rest on the assumption that returns follow a normal distribution, visualized as a symmetrical bell curve. This assumption simplifies interpretation but does not always match real market behavior precisely.
Under this framework, roughly 68 percent of outcomes fall within one standard deviation range of the mean. This creates an intuitive way to estimate a probability of price movement within a defined band.
Extending further, about 95 percent of outcomes fall within two standard deviations, and nearly all fall within three standard deviations. This forms the basis of the confidence interval used to frame the expected range of returns.
Why Real Stock Returns Don’t Always Follow a Normal Distribution
Real markets frequently produce fat tails, meaning extreme outcomes occur more often than a normal distribution would predict. This pattern challenges the reliability of standard deviation as a complete risk description.
Skewness and kurtosis further complicate the picture, since returns can lean in one direction or cluster with unusually sharp peaks. These statistical properties reveal shape details that standard deviation alone cannot capture.
Black swan events and other extreme price moves demonstrate the limitations of the normal distribution assumption clearly. Relying only on standard deviation risks underestimating tail risk during periods of severe market stress.
Using Standard Deviation to Compare and Choose Stocks
Comparing two stocks using standard deviation offers a quick way to judge which one experiences more dramatic price swings. This comparison becomes especially useful when both stocks belong to similar sectors or market caps.
A purely risk-adjusted comparison looks beyond raw dispersion and considers how much return an investor receives per unit of risk taken. Standard deviation alone cannot answer that question without additional context.
This is where volatility per unit of return becomes relevant, helping frame whether extra risk is proportionally rewarded. Such thinking connects directly to broader portfolio diversification strategies used across many holdings.
Matching a stock’s volatility profile to personal risk tolerance matching helps investors build portfolios aligned with their own comfort level. Some prefer stable vs aggressive stocks, depending on their financial goals and time horizon.
Analysts also use standard deviation for screening for volatility, filtering large stock universes down to a manageable list. This screening step often precedes deeper fundamental or technical research on individual candidates.
Comparing Stocks with Different Price Levels or Returns (Coefficient of Variation)
Comparing stocks with very different price levels or average returns can distort a simple standard deviation comparison. The coefficient of variation formula solves this by normalizing dispersion relative to the mean return.
This ratio, standard deviation divided by mean, produces a single number describing risk per unit of expected return. It supports normalizing volatility across stocks that otherwise would not compare fairly on raw numbers.
As a relative risk measure, the coefficient of variation helps investors evaluate two very different companies on equal footing. It complements standard deviation rather than replacing it in a broader analytical process.
Standard Deviation vs. Other Risk and Volatility Metrics
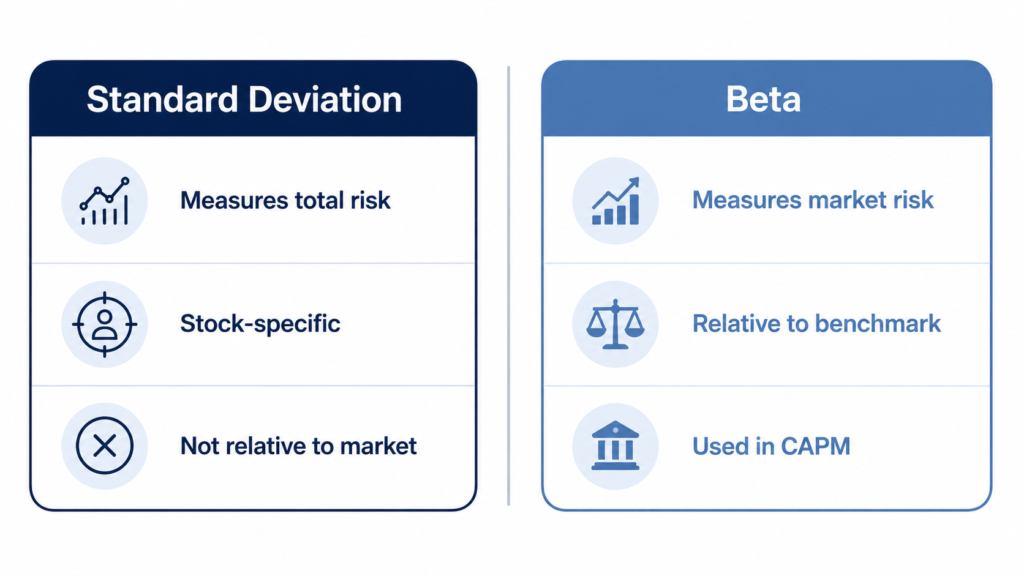
Comparing standard deviation vs beta highlights an important distinction between total risk and market-relative risk. Standard deviation captures overall price dispersion, while beta measures sensitivity to broader market movements specifically.
This connects to the difference between systematic risk vs total risk in portfolio theory. Beta isolates the portion of risk tied to the market, whereas standard deviation reflects every source of price movement combined.
The relationship between standard deviation vs variance is mathematical rather than conceptual, since one is simply the square root of the other. Both describe dispersion, but standard deviation is easier to interpret in practice.
Standard deviation also differs from the standard deviation vs Sharpe ratio comparison, since the Sharpe ratio incorporates return relative to risk. It uses standard deviation as an input rather than standing as a separate measure.
Other tools like the standard deviation vs average true range and standard deviation vs implied volatility serve related but distinct purposes. Comparing historical volatility vs implied volatility helps investors choose the right risk metric for their specific analytical need.
How Standard Deviation Shows Up in Technical Analysis Tools
Standard deviation appears directly inside popular charting tools as a standard deviation indicator applied to price data. Traders use this indicator to visualize volatility changes without manually calculating dispersion figures themselves.
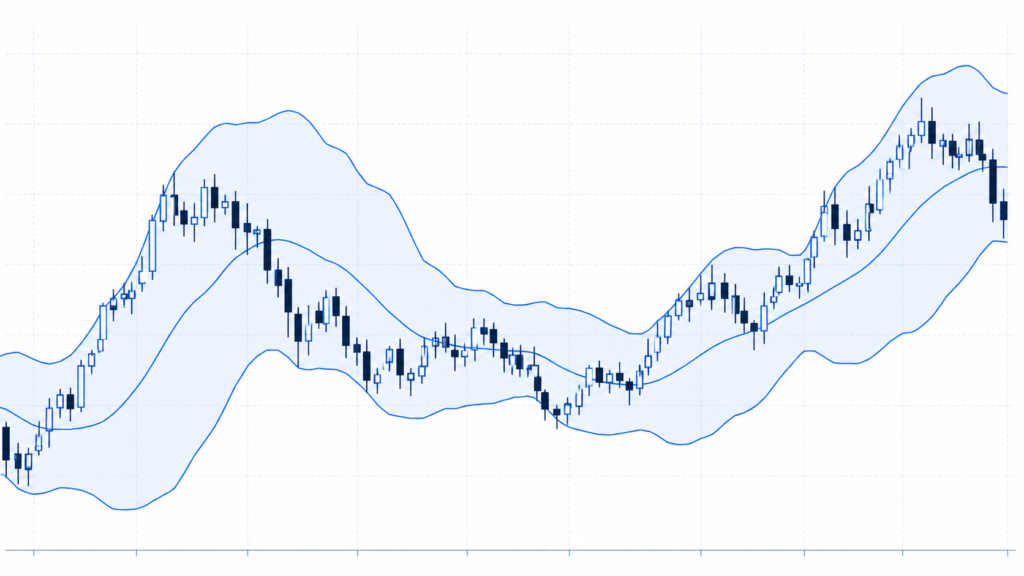
One of the most recognizable applications is Bollinger Bands, which plot bands above and below a moving average. These bands widen and narrow based on real-time standard deviation, reflecting shifting volatility conditions.
A related tool, the standard deviation channel, draws parallel lines around a price trend to highlight typical deviation boundaries. This creates visible volatility bands on a chart that traders monitor for potential reversals.
Configuring these tools involves adjusting technical indicator settings, particularly the lookback period used to calculate dispersion. A common choice is the 20-day standard deviation, balancing responsiveness with statistical reliability.
Most modern platforms include this functionality as a standard chart overlay, available within any general-purpose trading platform indicator library. This accessibility makes standard deviation a practical, everyday charting tool.
Practical Applications: Using Standard Deviation in Real Investment Decisions
Beyond theory, standard deviation informs several practical applications that shape how investors manage everyday decisions. It contributes to position sizing, stop-loss placement, and broader portfolio risk budgeting frameworks used across strategies.
As an options pricing input, standard deviation helps quantify expected price movement over a contract’s remaining life. This connects directly to setting expected price ranges used throughout derivatives markets and related instruments.
In everyday risk management applications, standard deviation supports decisions about how much capital to allocate toward a given position. Higher dispersion often calls for smaller position sizes to control potential downside exposure.
Investors frequently consider adjusting allocation based on volatility, shifting weight away from highly dispersed holdings during uncertain periods. This dynamic approach reflects standard deviation’s role as an ongoing monitoring tool.
These real-world use cases demonstrate that standard deviation extends well beyond academic statistics. It functions as a practical input across trading, portfolio construction, and broader financial planning conversations.
Setting Stop-Losses and Position Sizes Based on Volatility
A volatility-based stop-loss uses standard deviation to set exit points that reflect a stock’s normal trading range. This approach avoids placing stops too close, which can trigger exits during ordinary price noise.
Position sizing formula approaches often scale exposure inversely with volatility, reducing risk per trade for more dispersed stocks. This keeps potential losses roughly consistent across a portfolio regardless of individual stock behavior.
Investors typically use wider stops for volatile stocks and tighter stops for stable stocks, aligning risk controls with each stock’s statistical tendencies. This method ties directly back to the standard deviation figure calculated earlier.
Standard Deviation’s Role in Options Pricing
Standard deviation forms a core input within the Black-Scholes model, one of the most widely referenced options pricing frameworks. It quantifies expected price dispersion over the life of a contract.
The model relies on an implied volatility input, which reflects the market’s forward-looking expectation of standard deviation. This differs from historical figures, since it looks ahead rather than backward at past prices.
Changes in expected dispersion directly affect options premium levels, since greater volatility and option value tend to move together. Analysts often use historical volatility as a reference point when evaluating current implied figures.
Common Mistakes When Using Standard Deviation in Stock Analysis
One frequent error involves misinterpreting volatility as always bad, treating any high standard deviation as an automatic warning sign. In reality, dispersion simply reflects movement, not inherent quality or company weakness.
Another common issue is ignoring distribution shape, applying normal distribution assumptions without checking whether a stock’s returns actually fit that pattern. This oversight can lead to poorly calibrated expectations about future price behavior.
Analysts sometimes fall into the trap of using too short a data period, producing standard deviation figures that react too strongly to recent noise. A longer, more stable window often improves reliability significantly.
Mixing daily and annualized figures creates confusion when comparing stocks or communicating results to others. Every comparison should clearly state which timeframe the standard deviation reflects to avoid misleading conclusions.
Finally, treating standard deviation as a standalone metric and confusing it with beta are both frequent missteps. Compounding these issues, small sample size errors can distort results drawn from limited historical price data.
Frequently Asked Questions
What is a good standard deviation for a stock?
There is no single good standard deviation figure that applies universally across every stock or sector. What counts as reasonable depends heavily on typical range behavior within a specific industry group.
A useful approach involves benchmark comparison against a relevant index or peer group rather than judging the number in isolation. This context-dependent view aligns the figure with an investor’s personal risk tolerance.
What does a high standard deviation mean for a stock?
A high standard deviation meaning indicates the stock experiences larger, more frequent price swings than average. This reflects greater volatility, though it says nothing about whether those movements trend positively or negatively.
Because standard deviation captures price swings in both directions, it reflects upside vs downside risk equally. Investors should pair this figure with other tools before drawing conclusions about a stock’s overall quality.
How is standard deviation different from beta?
The core difference in standard deviation vs beta lies in scope. Standard deviation measures total risk from all sources, while beta isolates market risk relative to a broader benchmark index specifically.
This distinction matters for diversification decisions, since beta explains how a stock moves with the market, not how erratic its overall price behavior is on its own terms.
How do you calculate standard deviation for stock returns in Excel?
Calculating standard deviation in Excel starts with entering historical returns into a single column. From there, applying either the STDEV.P or STDEV.S function produces an instant Excel formula result.
This spreadsheet calculation approach removes the need for manual arithmetic, letting analysts recalculate figures instantly whenever new price data becomes available for the selected stock or time period.
How do you annualize daily standard deviation?
Annualizing volatility involves multiplying the daily figure by the square root of time, typically using the 252 trading days convention common across most financial markets, exchanges, and analytical platforms.
This daily to annual conversion produces a figure that can be fairly compared against other annualized volatility numbers, avoiding the confusion that mismatched timeframes often create for readers and analysts alike.
Is a lower standard deviation always better for a stock?
A lower standard deviation is not automatically better, since it often reflects a stability vs return tradeoff rather than superior quality. Steadier stocks may also deliver more modest long-term returns.
This common misconception overlooks the broader risk-return tradeoff central to investing. Lower dispersion suits some strategies, while others intentionally accept higher volatility in pursuit of greater potential returns.
What’s the difference between standard deviation and variance?
The distinction in variance vs standard deviation centers on units. Variance reports dispersion in squared units, which are difficult to interpret directly against actual price or return figures.
Standard deviation solves this through the square root, restoring the original unit scale. This improves interpretability, making standard deviation the more commonly cited figure in everyday stock analysis.
Can standard deviation predict future stock price movement?
Standard deviation cannot predict direction or timing, since it is fundamentally a historical measure built from past price data. Its predictive limitations mean it describes patterns rather than forecasting outcomes.
Because it remains a backward-looking calculation, standard deviation only supports an expected range assumption for future behavior. It offers context, not certainty, about what a stock might do next.
How many days of data should you use to calculate a stock’s standard deviation?
The right lookback period depends on the analytical goal, with common choices including a 20-day, 63-day, or 250-day data window for different purposes and trading styles.
Shorter windows increase responsiveness to recent price changes, while longer windows improve reliability. This tradeoff between responsiveness vs reliability guides most analysts when selecting an appropriate calculation period.