
What Is Stock Analysis?
Stock analysis is the structured process investors use to study a company before making an investment decision. It examines financial data, price behavior, and business fundamentals to judge whether a stock deserves attention right now.
At its core, evaluating stocks means comparing what a company is worth against what the market currently charges for its shares. Analysts look at earnings, assets, competitive position, and growth potential across each individual business.
A central idea in stock analysis is intrinsic value, the estimated true worth of a business based on its fundamentals. Market price and intrinsic value often diverge because emotions, news, and speculation influence trading daily.
Stock price movement reflects far more than company performance alone. Interest rates, economic cycles, investor psychology, and global events all shift prices constantly. Stock analysis tries to separate meaningful signals from constant short-term market noise.
Ultimately, stock analysis supports a buy sell hold decision, though it never guarantees outcomes. It relies on market data evaluation, historical patterns, and reasoned judgment rather than certainty, since several distinct analysis types exist today.
The Main Types of Stock Analysis at a Glance
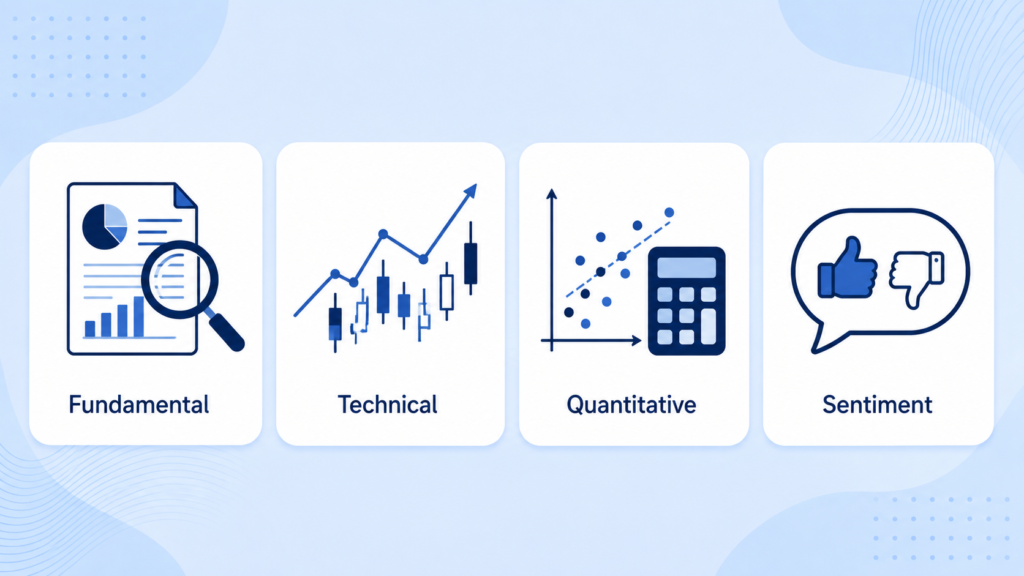
Investors rely on four broad approaches when studying individual stocks. Fundamental analysis, technical analysis, quantitative analysis, and sentiment analysis each examine markets from a different angle. Together they form a comparison of stock analysis methods.
Fundamental analysis focuses on a company’s financial health, business model, and competitive standing. It asks whether a business is fundamentally sound and reasonably valued. This method suits investors who prefer studying operations over price moves.
Technical analysis studies price charts, trading volume, and historical patterns. It assumes price behavior reflects collective investor psychology and can reveal future movement. This analysis approach shows why technical methods dominate shorter time frames.
Quantitative analysis applies statistics and computer models to evaluate stocks systematically. It removes emotional judgment found in other methods, relying instead on data patterns. Meanwhile, sentiment analysis measures investor mood through news and social media.
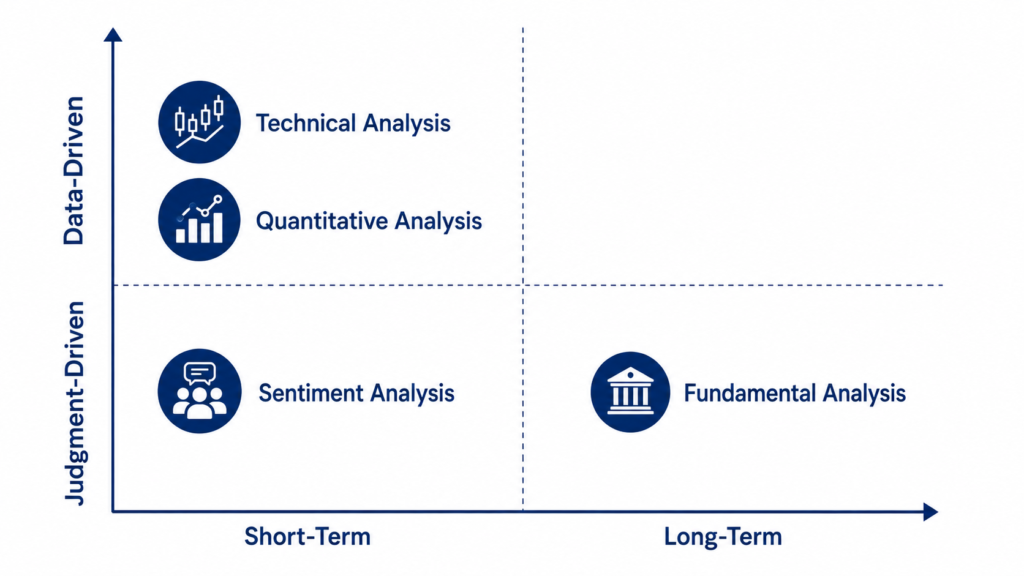
Choosing between these approaches often depends on investor style and objectives. Some investors blend methods, while others specialize in one. Understanding the long-term vs short-term analysis distinction helps clarify which combination of tools fits best.
Fundamental Analysis
Fundamental analysis is the study of a company’s true business value through financial and qualitative research. By definition, it evaluates company financial health using measurable financial data carefully. This forms the foundation of long-term investing.
Central to this method are the core financial statements: the income statement, balance sheet, and cash flow statement. Each document reveals a different dimension of performance, from profitability to liquidity to overall cash movement patterns.
Fundamental analysis also considers qualitative factors that numbers alone cannot capture. Management quality, leadership decisions, and strategic direction often determine whether a company sustains its advantages. These softer elements complement financial statements and add depth.
A company’s economic moat, or sustainable competitive advantage, plays a major role in fundamental research. Combined with broader industry analysis, this helps investors judge whether performance is likely to continue or fade as pressures shift.
By blending financial data with qualitative judgment, fundamental analysis aims to estimate intrinsic value more precisely. Investors then compare this estimate to market price. This process explains why fundamental analysis remains central to research-driven investing.
Qualitative Fundamental Analysis
Qualitative fundamental analysis examines the non-numeric characteristics that shape a company’s future outlook. Management quality sits at the center of this evaluation, since leadership decisions directly influence strategy, capital allocation, and business response to change.
Investors also study competitive advantage and brand strength when assessing qualitative factors. A strong industry position often signals pricing power and customer loyalty. These traits are harder to measure than earnings but explain long-term resilience.
Business model evaluation and corporate governance round out qualitative research. Understanding how a company earns money, and whether it operates transparently, helps investors judge sustainability. Together, these qualitative factors provide essential context beyond raw numbers.
Quantitative Fundamental Analysis
Quantitative fundamental analysis relies on measurable data drawn directly from company reports. Financial ratios, including earnings per share, help investors compare profitability across companies and reporting time periods. This numeric evaluation offers an objective foundation.
Revenue growth and profit margins reveal how efficiently a company converts sales into actual earnings. Analysts also examine debt levels closely to understand financial risk. High leverage can amplify returns but increases vulnerability during downturns.
Return on equity measures how effectively a company uses shareholder capital to generate profit. Combined with broader financial statement analysis, these metrics create a structured, numbers-based picture that complements the qualitative side of fundamental research.
Top-Down vs. Bottom-Up Fundamental Analysis
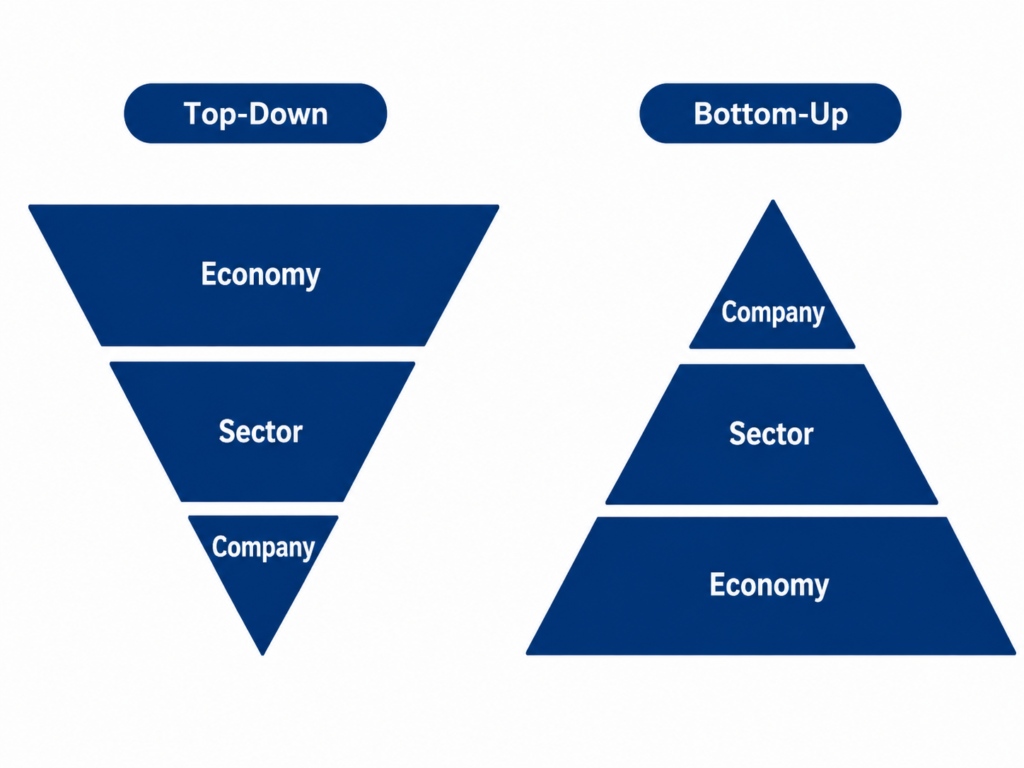
Top-down analysis begins with the broader economic picture before narrowing its focus. Investors examine macroeconomic factors such as interest rates, inflation, and growth trends first. This wider lens helps identify favorable sectors before selecting companies.
Bottom-up analysis works in reverse, starting instead with individual company research regardless of broader economic conditions. This company-specific analysis prioritizes business fundamentals over macro trends, assuming strong companies can perform well during uncertain economic environments.
Many investors combine both approaches for a more complete overall perspective. Sector analysis bridges the gap, connecting broad economic themes to specific industries. This investing approach comparison shows there is no single correct starting point.
Common Fundamental Valuation Methods
The discounted cash flow method, often called DCF analysis, estimates value by projecting future cash flows and discounting them to present terms. It is one of the most widely taught methods for intrinsic value calculation.
The dividend discount model values companies based on expected future dividend payments, making it especially relevant for stable, income-generating businesses. It works best when applied to companies with predictable, consistent dividend histories over extended periods.
Comparable company analysis takes a different route, evaluating a stock against similar businesses using valuation multiples like the price-to-earnings ratio. This method offers a faster, more market-based perspective compared to detailed cash flow modeling approaches.
Technical Analysis
Technical analysis studies stock price charts and trading activity rather than company fundamentals. By definition, it assumes historical price behavior can offer clues about future movement, making it popular among traders focused on shorter horizons.
This approach relies heavily on price patterns that repeat across different stocks and markets. Analysts believe these patterns reflect predictable aspects of investor psychology. Recognizing them requires practice, but traders consider pattern recognition a skill.
Trading volume plays an important supporting role in technical analysis. Rising volume alongside price movement often signals stronger conviction behind a trend. Without sufficient volume, price changes may carry less reliability and warrant more caution.
Because technical analysis emphasizes market timing, it suits short-term trading more naturally than long-term investing. Traders use chart-based analysis to identify precise entry and exit points, often holding positions for a few days or minutes.
Technical analysis draws entirely from historical price data, assuming markets move in observable, repeatable ways. Concepts like momentum help traders gauge strength behind a move. This makes technical analysis a distinct discipline from fundamental research.
Chart Patterns and Trend Analysis
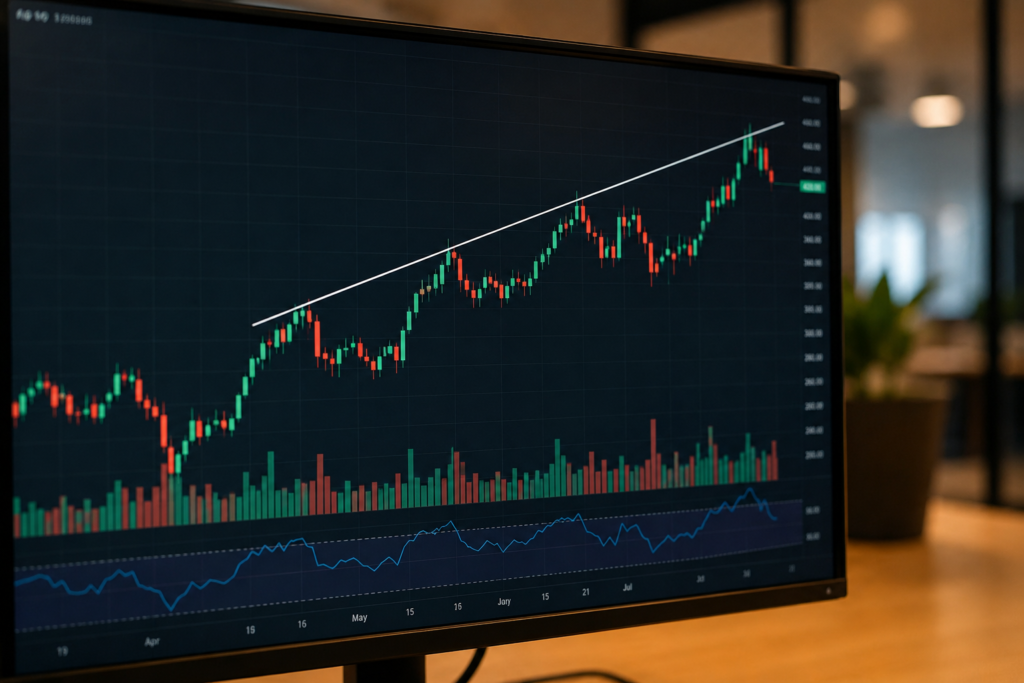
Candlestick patterns provide visual snapshots of price behavior over specific time intervals. Each candle reveals opening, closing, high, and low prices, helping traders interpret short-term sentiment shifts and potential turning points within an ongoing trend.
The head and shoulders pattern is a widely recognized formation signaling possible trend reversal. Traders also rely on trendlines to visualize direction, connecting price points to reveal whether a stock follows an upward path consistently.
Identifying an uptrend or downtrend early can shape trading decisions significantly. This chart pattern recognition process, combined with attention to price action, forms the foundation of most technical trading strategies many active traders use today.
Key Technical Indicators
The relative strength index, commonly called RSI, measures the speed and magnitude of recent price changes. It helps traders identify overbought oversold signals, offering insight into whether a stock may be due for a reversal.
Moving average convergence divergence, or MACD, compares two moving averages to reveal shifts in momentum. This indicator is widely used alongside simple moving averages to confirm trend direction and filter out short-term price movement noise.
Bollinger Bands measure volatility by plotting bands around a moving average. When price approaches these bands, traders interpret it as a potential signal. Together, these momentum indicators give traders multiple confirming perspectives on price behavior.
Support and Resistance Levels
A support level represents a price point where buying interest historically prevents further decline, acting like a price floor. Traders watch these levels closely, since repeated bounces can indicate strong underlying demand for a stock.
A resistance level works oppositely, functioning as a price ceiling where selling pressure typically emerges. When price struggles to move higher repeatedly, resistance often signals growing hesitation among buyers or profit-taking among existing shareholders currently.
A breakout above resistance or a breakdown below support often generates significant trading interest immediately. These moments are considered important technical trading signals, frequently triggering meaningful shifts in short-term trading strategy and position sizing decisions.
Quantitative Analysis
Quantitative analysis, by definition, applies mathematics and statistics to evaluate stocks systematically. Rather than relying on judgment alone, it uses statistical models to identify clear patterns across large datasets, aiming for consistency and long-term repeatability.
This approach often powers algorithmic trading, where computer programs execute trades based on predefined rules. Quant investing removes much emotional bias from individual decisions, though the underlying models still require careful human design and oversight.
Mathematical models used in quantitative analysis can incorporate price data, financial ratios, and macroeconomic variables simultaneously. This data-driven stock analysis approach allows investors to systematically test multiple factors at once across many securities more efficiently.
Backtesting is essential to quantitative research, allowing analysts to carefully test strategies against historical data before applying them live. This process helps validate assumptions, though past performance never guarantees future results in rapidly changing markets.
Factor investing and systematic trading represent common applications of quantitative methods today. These strategies target specific characteristics, such as value or momentum, applying consistent rules across large portfolios rather than relying purely on individual judgment.
How Quantitative Models Evaluate Stocks
Quantitative models begin with statistical analysis of historical price and financial data. By identifying recurring relationships between variables, these models attempt to forecast future performance with greater objectivity than purely subjective evaluation methods usually allow.
Historical data modeling helps quantify how stocks have behaved under similar past conditions. Analysts build factor models that isolate specific drivers of return, such as valuation, quality, or momentum, testing each across large historical data.
These models also calculate risk-adjusted returns, weighing performance against volatility rather than raw gains alone. Algorithmic screening then filters thousands of stocks quickly, generating useful quantitative signals that guide further research or automated trading decisions.
Quantitative Analysis vs. Fundamental and Technical Analysis
Comparing quant vs fundamental approaches reveals a key difference in method. Fundamental analysis relies on human interpretation of financial statements, while quantitative analysis processes large datasets systematically, often evaluating many companies simultaneously rather than one.
Looking at quant vs technical analysis, both study price data, but quantitative methods apply rigorous statistical testing rather than visual pattern recognition. This distinction highlights differing philosophies about how markets generate meaningful, repeatable trading signals.
The broader contrast lies in systematic vs discretionary investing. Quantitative analysis follows strict rules-based investing frameworks, while fundamental and technical analysis often involve human judgment vs algorithms, blending experience with interpretation rather than fixed rules.
Sentiment Analysis
Sentiment analysis, by definition, studies investor emotions and attitudes rather than financial statements or price charts alone. It attempts to measure investor sentiment as a driving force behind short-term price swings and broader market behavior.
This method draws heavily on behavioral finance, which examines how psychology influences financial decisions. Fear, excitement, and herd behavior often push prices away from fundamental value, creating opportunities and risks that analysis attempts to identify.
Market mood can shift quickly, sometimes independent of actual company performance. Analysts track news sentiment and social media sentiment to gauge how public perception evolves, recognizing that this perception itself can influence near-term trading activity.
Understanding crowd psychology helps explain why markets sometimes overreact to news events. When sentiment becomes extreme in either direction, some investors adopt contrarian investing strategies, positioning against prevailing emotional trends rather than following them blindly.
Sentiment analysis works best as a complement to other methods rather than a standalone strategy. It adds context about market psychology, helping investors understand emotional extremes that fundamental and technical analysis alone cannot fully capture.
News and Social Media Sentiment Analysis
News sentiment tracking involves analyzing headlines, articles, and press releases for emotional tone. Modern tools increasingly rely on natural language processing to scan large volumes of text quickly, identifying whether coverage leans positive or negative.
Social media sentiment has become increasingly influential, as public platforms allow rapid spread of opinions and reactions. Sentiment scoring tools attempt to quantify this activity, converting informal commentary into measurable data investors can analyze closely.
Earnings call sentiment offers another valuable data point, examining executive tone and language during quarterly discussions. Subtle shifts in confidence or hesitation can sometimes reveal information beyond what official financial figures communicate directly to investors.
Market-Wide Sentiment Indicators
The VIX volatility index measures expected market volatility, often nicknamed the fear gauge. Rising values typically signal growing investor anxiety, while lower readings suggest calmer, more confident market conditions overall across the broader financial markets.
The put/call ratio compares trading volume between put and call options, offering insight into whether investors lean bearish or bullish. Extreme readings sometimes indicate sentiment has moved toward an unsustainable emotional extreme worth watching closely.
The fear and greed index combines multiple indicators into a single sentiment gauge. Alongside investor surveys, these broader market sentiment gauges help analysts understand collective psychology across the entire market rather than individual stocks alone.
How to Choose the Right Type of Stock Analysis for Your Goals
Choosing a stock analysis method starts with understanding personal investing goals clearly. Someone building long-term wealth may prioritize fundamentals, while someone seeking frequent trading opportunities might lean toward faster, price-driven approaches instead of research-heavy methods.
Your investing style matters significantly in this important decision. A long-term investor often values patience and business quality, making fundamental analysis a natural fit. Meanwhile, active traders frequently favor tools built for speed and precision.
A short-term trader typically prioritizes technical or quantitative methods, since these approaches focus heavily on price behavior rather than deep business fundamentals. Faster decision-making requires tools designed to interpret rapid market movement effectively and efficiently.
Risk tolerance and time horizon also shape which method fits best for each investor. Investors comfortable with volatility may explore technical or sentiment-based approaches, while risk-averse investors often prefer the steadier, research-intensive nature of fundamentals.
For beginner stock analysis, starting simple often works best in the long run. Understanding your investor skill level honestly helps avoid overwhelming complexity early on, allowing gradual progression toward more advanced techniques as confidence grows.
Combining Multiple Types of Stock Analysis
Hybrid stock analysis blends multiple methods to capture different strengths simultaneously within one process. Many experienced investors avoid relying on a single approach, recognizing that no individual method captures every relevant dimension of market behavior.
Combining fundamental and technical analysis is a common strategy among many practitioners today. Fundamentals help identify strong businesses, while technical signals assist with timing decisions. This pairing addresses both business quality and market entry considerations.
Using multiple analysis methods together can also involve sentiment or quantitative inputs. Adding sentiment context helps investors understand emotional extremes, while quantitative screening narrows large universes of stocks into more manageable, research-ready shortlists more quickly.
This layered approach often separates entry and exit timing decisions from broader investment selection choices. Fundamentals may answer what to buy vs when to buy, while technical or quantitative tools help refine the timing component.
A multi-method investing strategy requires more effort but can often offer a fuller overall picture. By blending different analytical lenses, investors reduce reliance on any single method’s blind spots, creating more balanced and informed decision-making.
Common Mistakes and Limitations of Each Analysis Type
Every analytical method carries inherent weaknesses worth noting. Limitations of fundamental analysis include reliance on assumptions about future growth, which can prove inaccurate. Even careful research cannot fully predict unexpected competitive, regulatory, or economic developments.
Limitations of technical analysis stem from its reliance on historical patterns repeating over time. Markets evolve, and past price behavior does not guarantee future outcomes. False chart patterns can mislead traders who interpret normal volatility.
Overreliance on indicators is a common mistake across technical and quantitative approaches alike. No single indicator works perfectly in every market environment, and blindly following signals without broader context often leads to poor overall decision-making.
DCF assumption sensitivity highlights a specific fundamental analysis risk, since small changes in growth or discount rate assumptions can dramatically shift valuation outcomes. This makes fundamental valuation more of an art than precise mathematical certainty.
Sentiment analysis noise and confirmation bias create additional challenges across all methods discussed so far. Investors often seek information confirming existing beliefs, ignoring contradictory signals. Recognizing these common investing mistakes helps build more disciplined habits.
Tools and Resources for Each Type of Stock Analysis
Modern stock analysis software consolidates financial data, charts, and research tools into unified platforms today. These resources save considerable time compared to manually gathering data from multiple scattered sources across different websites, reports, and databases.
Charting platforms support technical analysis by displaying detailed price history, indicators, and pattern recognition tools clearly. Many offer customizable layouts, allowing traders to build personalized dashboards suited to their own preferred trading style and strategy.
Financial statement databases provide access to company filings, historical earnings, and detailed balance sheet details essential for fundamental research. These resources help investors verify data directly rather than relying solely on secondary summaries or interpretations.
Stock screeners allow investors to filter thousands of companies based on specific financial or technical criteria quickly. Combined with quantitative backtesting tools, screeners help narrow broad markets into focused, manageable research candidates more efficiently overall.
For sentiment research, sentiment tracking tools analyze news and social activity systematically. Investors should weigh free vs paid analysis tools carefully, since paid platforms often provide deeper data, though free resources remain useful starting points.
Frequently Asked Questions
What are the 4 main types of stock analysis?
The main types of stock analysis are fundamental analysis, technical analysis, quantitative analysis, and sentiment analysis. Each examines markets differently, focusing on business fundamentals, price charts, statistical models, or investor psychology and emotion.
Which type of stock analysis is best for beginners?
Fundamental analysis for beginners is often considered the most approachable easiest analysis method, since it focuses on understandable business concepts like earnings, revenue, and financial health rather than complex charts or statistical modeling
Is fundamental analysis or technical analysis better?
Neither method is universally better. The fundamental vs technical analysis debate depends on goals. Long-term investing often favors fundamentals, while short-term trading typically benefits more from technical, price-based analytical approaches.
Can you use more than one type of stock analysis at the same time?
Yes, combining analysis methods is common practice. A hybrid approach using fundamental and technical together allows investors to evaluate business quality while also considering timing, price trends, and short-term market behavior.
What is quantitative stock analysis and how is it different from technical analysis?
Quantitative analysis vs technical analysis differs in scope. Quantitative methods use broad statistical models and algorithmic analysis across many variables, while technical analysis focuses specifically on visual price charts and trading patterns.
What is sentiment analysis in stock trading?
By sentiment analysis definition, this method studies investor mood through news and social platforms. It can act as a contrarian indicator, since extreme optimism or pessimism sometimes signals potential market turning points ahead.
Do professional investors use technical analysis or fundamental analysis?
Many professional investors use both, depending on strategy. Institutional investing often blends approaches, while certain hedge fund analysis methods rely heavily on quantitative and technical models for systematic, rules-based decision-making.
What tools do I need to start analyzing stocks?
Beginners typically need basic stock analysis tools, including charting software for price data and reliable financial data sources for company research. A simple stock screener also helps narrow initial investment candidates efficiently.