
What Are Support and Resistance Levels?
Support and resistance levels are price zones on a price chart where historical buying or selling has repeatedly paused movement, forming the foundation of technical analysis basics for reading price behavior, under most market conditions.
A support level functions like a price floor, where buying pressure has historically overwhelmed selling pressure enough to stop a decline. A resistance level works oppositely, acting as a price ceiling, across most trading sessions.
Both concepts trace back to supply and demand. When more buyers than sellers compete at a price, that area tends to hold as support; when sellers dominate, the same dynamic creates resistance above current price.
These are not rigid mathematical boundaries but observed tendencies. A horizontal level drawn from past turning points reflects where enough market participants previously agreed on value, creating a repeatable pattern worth watching closely today, overall.
Understanding this foundation matters because nearly every other technical concept, from trendlines to indicators, ultimately measures price against these reference zones. Mastering support and resistance is often the first real skill a chart reader develops.
Support Level Explained
A support level marks a demand zone where buyers stepping in have historically slowed or reversed a price decline reversal. It represents a point where accumulated buying interest clearly outweighs the urge to sell further.
Picture a downtrend pause at a specific price: sellers grow exhausted, and buying interest increases sharply enough to absorb remaining supply. That absorption is precisely what creates the visible floor on a price chart, today.
Support does not guarantee a bounce every time price approaches it. It simply marks a zone where reversal has happened before, giving traders a probability-based reference rather than any certainty about future price direction.
Resistance Level Explained
A resistance level marks a supply zone where sellers stepping in have historically capped an advancing price. It reflects a concentration of selling interest strong enough to overcome fresh buying demand at that specific point.
During an uptrend pause, momentum slows as profit-taking and new short-selling combine near the same price band. This concentrated selling interest creates a visible ceiling that repeatedly turns back rallies at very similar levels, reliably.
Like support, resistance reflects historical tendency rather than a fixed rule. A price rally reversal near resistance is common, but traders should treat it as one input among several signals, not an absolute guarantee, consistently.
The Role Reversal Principle (Support Becomes Resistance and Vice Versa)
One of the more reliable observations in chart reading is role reversal: once broken, a former support level frequently becomes new resistance, and a broken resistance level frequently becomes new support going forward instead, typically.
This polarity flip happens because market participants who missed selling at the old level now view a retest as a second chance. Traders trapped on the wrong side often act at that same price again.
Recognizing this level flip helps traders anticipate where price might pause after a breakout, since broken support becomes resistance and broken resistance becomes support far more often than pure chance would ever suggest happening, currently.
Why Support and Resistance Levels Work (The Psychology Behind the Chart)

Support and resistance persist because markets are driven by human decision-making, not pure mathematics. Market psychology shapes how traders remember prices, react to news, and position themselves around previously significant chart levels repeatedly, in practice.
Anchoring bias plays a central role here. Traders unconsciously anchor expectations to a price where something notable happened before, whether a sharp reversal or a failed breakout, and that memory shapes future trading decisions, generally.
This creates a self-fulfilling prophecy: enough traders watch the same level, place orders near it, and act similarly enough that their collective behavior actually produces the reaction everyone originally expected in the first place, specifically.
Order flow reinforces this pattern through stop-loss clusters that accumulate just beyond obvious levels. When price reaches these clusters, institutional orders and retail stops trigger together, sharply accelerating movement and reinforcing the level’s importance, carefully.
Round number bias and trader memory compound the effect further. Prices ending in clean figures attract disproportionate attention, and herd mentality ensures crowded levels stay relevant long after the original catalyst has completely faded, overall.
Types of Support and Resistance Levels
Not all support and resistance behaves identically. Traders generally separate levels into horizontal support resistance, which stays fixed at one price, and dynamic support resistance, which shifts gradually as price and time progress forward, today.
Static levels are drawn from clear historical turning points and remain unchanged until tested or broken. They work well in ranging markets where price repeatedly returns to the same general area over extended time, closely.
A moving level behaves differently, adjusting continuously alongside price trends. Trendlines and moving averages fall into this category, requiring traders to constantly update their reference points as new price data steadily arrives each day, reliably.
Some traders also distinguish between a precise line and a wider zone vs line approach, treating support and resistance as bands rather than exact prices, which better reflects how imprecise market reactions tend to be.
Each type has its place depending on market conditions. Ranging conditions favor horizontal analysis, while trending conditions often reward closer attention to dynamic, angled levels that track directional momentum far more accurately over time, consistently.
Horizontal (Static) Support and Resistance
Horizontal (static) support and resistance levels connect a flat price level across multiple points in time, typically drawn from a clear swing high or swing low visible directly on the price chart itself, over time.
These levels shine during price consolidation, when a market lacks a strong directional bias. In a ranging market, horizontal lines often mark the exact edges where price repeatedly reverses within a defined trading channel, typically.
Because they remain fixed, horizontal levels are the easiest type for beginners to identify and monitor, making them a natural starting point before progressing toward more dynamic, trend-based technical analysis methods used later on, currently.
Trendline (Dynamic) Support and Resistance
A diagonal trendline connects a sequence of rising or falling turning points, sloping with the prevailing trend rather than sitting flat. It adjusts its price level continuously as time moves steadily forward each session, generally.
An ascending trendline connects higher lows during an uptrend, acting as dynamic support beneath price. A descending trendline connects lower highs during a downtrend, acting as dynamic resistance above price instead, quite reliably in practice.
When two trendlines run in parallel, they form a trend channel, giving traders both a directional bias and a visual boundary for where price may pause, reverse, or eventually break out fairly decisively later, specifically.
Moving Averages as Dynamic Support/Resistance
Moving averages smooth price data into a single line that can act as dynamic support resistance. The 50-day moving average and the 200-day moving average are widely watched benchmarks across many different financial markets today, carefully.
An EMA support or SMA resistance interaction occurs when price repeatedly approaches a moving average and reacts, similar to how it would behave near a traditional horizontal or diagonal trendline level on a chart, overall.
A moving average bounce tends to carry extra significance because so many market participants track the same widely used averages, reinforcing the self-fulfilling behavior that makes these dynamic levels genuinely meaningful in practice today.
Support/Resistance Zones vs. Exact Price Lines
Experienced traders often favor zone trading over pinpoint precision, treating support and resistance as a price band rather than a single exact number, since markets rarely respect lines down to the exact decimal, for traders.
A thick support area accounts for natural price noise, including wick tolerance for brief spikes that pierce a level without a genuine breakdown occurring, avoiding premature conclusions drawn from just a single candle, across sessions.
Building in a false breakout buffer helps traders avoid reacting to minor overshoots. This approach acknowledges that real markets involve imprecision, and rigid lines can create far more confusion than clarity in practice, under scrutiny.
How to Identify Support and Resistance Levels on a Chart

Learning how to find support resistance starts with a systematic approach to identifying key levels rather than guessing at lines. Consistency in method matters more than raw intuition when reading historical price action closely, overall.
The most direct chart reading steps begin with scanning a chart for obvious turning points where price clearly reversed direction multiple times, since these visually stand out even to a fairly inexperienced observer, in practice.
From there, traders refine their view by adjusting the chart lookback period, since levels formed recently often carry more relevance than ones formed years earlier under very different market conditions and circumstances entirely, over time.
Combining visual inspection with objective tools, such as indicators or volume data, adds confirmation and reduces the subjectivity that naturally creeps into manual chart marking exercises performed differently by individual traders each time, in general.
This process is iterative rather than one-time. As new price data forms, previously drawn levels may need adjustment, confirmation, or removal entirely as their relevance to current trading conditions steadily evolves over time, for traders.
Using Historical Price Action and Swing Points
Identifying a swing high or swing low involves locating candles where price clearly reversed after reaching a local extreme, forming a visible peak or trough directly on the price chart for future reference, across sessions.
These prior highs and lows become the raw material for drawing horizontal levels. The more distinct and isolated the swing point, the more significance traders typically assign to that particular price going forward, under scrutiny.
Reviewing historical reversal points across a meaningful stretch of data, rather than just the most recent candles, produces a more complete and reliable map of where support and resistance genuinely exist today, in most cases.
Using Volume to Confirm a Level
A volume spike accompanying a price reversal adds credibility to a level, since it shows genuine participation rather than a thin, low-conviction move that could reverse just as easily in the next session, in practice.
High volume rejection at a specific price suggests real supply or demand entered the market there, offering stronger volume confirmation than a level formed purely on unusually quiet, low-conviction trading activity overall, across most markets.
Conversely, a low volume breakout through a level raises doubt about its legitimacy. Examining the volume profile around a breakout helps traders judge whether the move genuinely reflects real conviction or not, for active traders.
Using Technical Indicators (Fibonacci Retracement, Pivot Points, Bollinger Bands)
Fibonacci retracement levels, particularly the 38.2% 50% 61.8% ratios, offer mathematically derived zones where a prior price move often pauses or reverses during a corrective phase before the broader trend eventually resumes again, over time.
Standard pivot points, along with camarilla pivot points and Demark pivot points, calculate levels from the prior period’s high, low, and close, giving traders an objective daily reference framework for the current session, in general.
Bollinger Band support resistance adds a volatility-based perspective, since the bands expand and contract with price movement, offering dynamic boundaries that complement more traditional static and diagonal levels already drawn on the chart, for traders.
How to Measure the Strength and Reliability of a Level
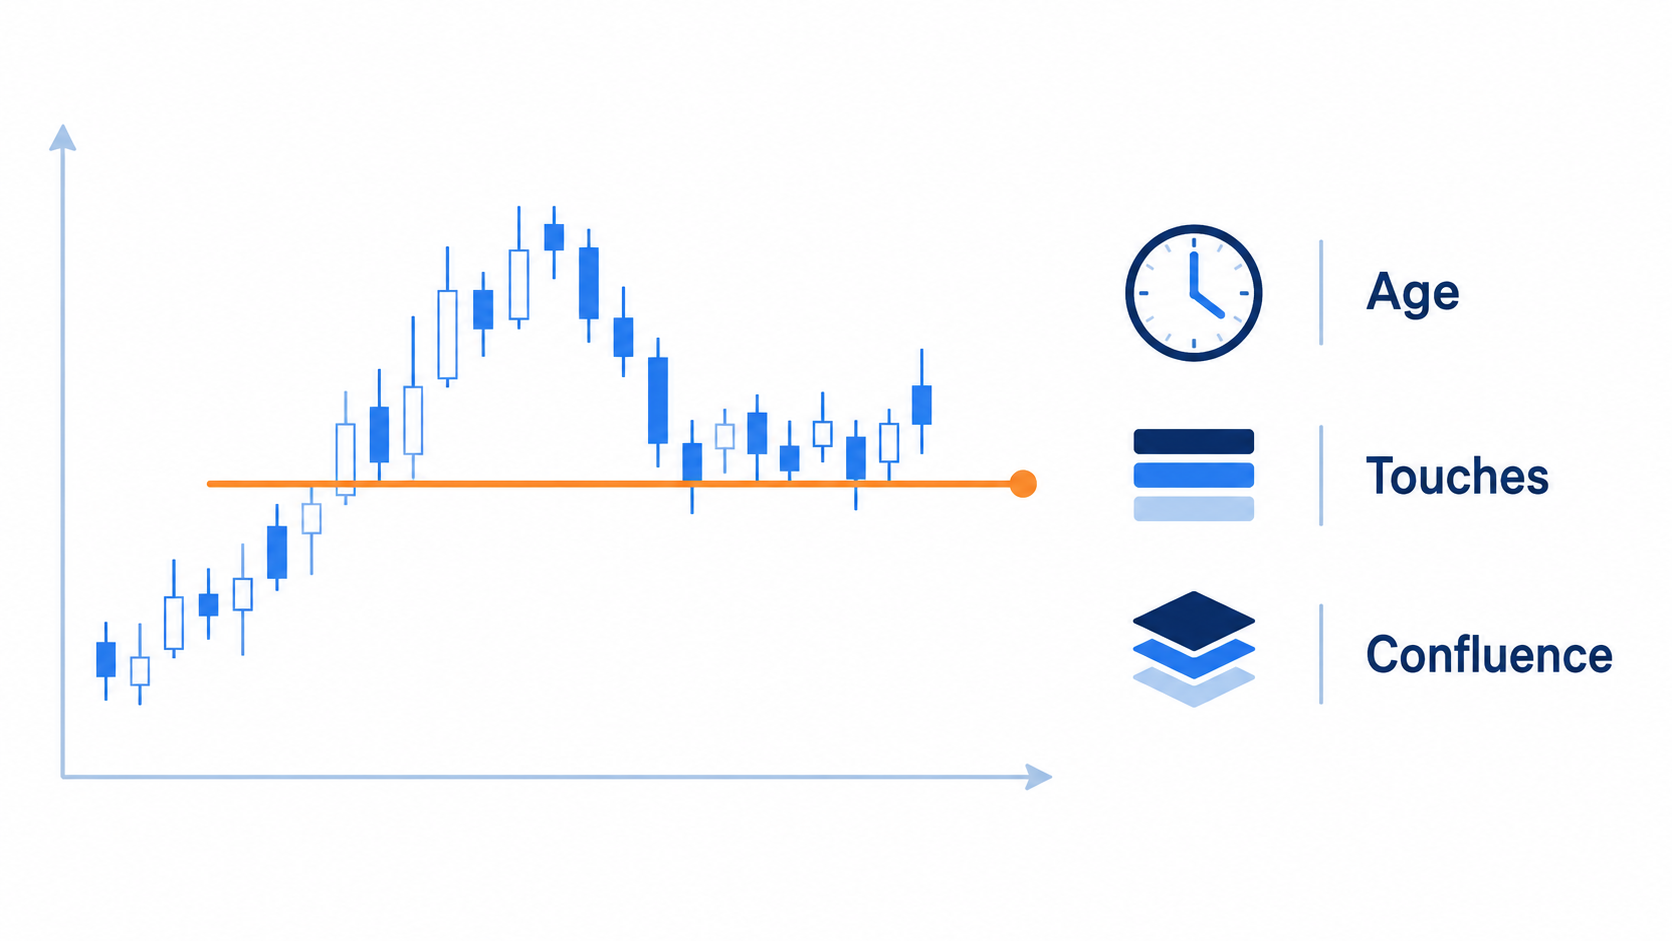
Not every level carries equal weight. Judging level strength requires looking beyond a single touch and considering several factors together to form a more complete reliability score for any given price level, across many timeframes.
The clearest starting point is the number of touches a level has received. A level respected multiple times generally signals broader market agreement than one that formed from a single isolated event, for seasoned traders.
Timeframe confluence adds another layer. A level visible across several chart intervals, from intraday to weekly views, generally carries more significance than one only visible on a single short, narrow timeframe alone, in most cases.
Volume confirmation should factor in as well, since levels formed on heavy trading activity tend to represent genuine participation rather than a thin move likely to fail quickly under real market pressure, across most markets.
Finally, level age matters. Asking how strong is support must include a check on how recently the level formed, since older levels can gradually lose relevance as market conditions continue to evolve, for active traders.
Number of Touches
A level tested only once carries limited proof of its significance, but multiple touches strengthen the case that real buying or selling interest consistently exists at that specific, well-defined price point, for traders reading charts.
When a level tested twice shows a similar reaction both times, confidence grows. If a level tested three times continues holding, many traders treat it as an increasingly dependable, well-proven reference point, across many timeframes.
However, repeated rejection can eventually exhaust the level, since each test consumes some of the available orders defending it, making an eventual breakout increasingly more likely the more times it is tested, for seasoned traders.
Timeframe Confluence
Comparing a daily chart level against the same approximate price on a weekly chart level reveals whether a zone carries importance across multiple perspectives rather than just one narrow, isolated view alone, in most cases.
Multi-timeframe analysis helps traders avoid overreacting to minor levels that only matter on short intraday charts while ignoring more significant structural levels visible on longer-term price history spanning weeks or even months, across most markets.
Generally, higher timeframe priority applies: a weekly or monthly level tends to override a conflicting intraday level, since it reflects a much longer accumulation of trading decisions and overall participant conviction, for traders watching closely.
Age and Recency of the Level
An old support level formed years earlier may no longer reflect current market conditions, fundamentals, or participant behavior, even if the price line still appears visually clean on today’s chart entirely, across many different markets.
Recent price action tends to carry more weight because it reflects the current balance of buyers and sellers, who are actively trading under today’s conditions rather than outdated, no longer relevant circumstances, for active traders.
This concept of level relevance decay reminds traders to periodically revisit and prune old levels, keeping only those that remain meaningfully connected to how the market is currently and actively behaving, under most market conditions.
How to Trade Using Support and Resistance Levels
A support resistance trading strategy generally revolves around identifying a clear entry point near a well-tested level and planning both an exit point and appropriate risk parameters carefully before acting on it, across many timeframes.
Two broad approaches dominate this style of trading: a bounce trade, which anticipates reversal at a level, and a breakout trade, which anticipates a decisive move straight through that same level instead, for seasoned traders.
Proper stop-loss placement and a defined take-profit target are essential regardless of approach, since they translate a chart observation into a structured plan with clearly measurable risk and expected reward outcomes, across most trading sessions.
Many traders wait for a reversal candle confirmation before entering, avoiding the temptation to act purely on price approaching a level without any supporting signal from actual observed price behavior nearby, for traders reading charts.
Ultimately, no single method works in isolation. Combining level identification with confirmation signals and disciplined risk management forms the backbone of a coherent, repeatable trading approach that most experienced traders eventually develop, in most cases.
Bounce (Reversal) Strategy
The bounce strategy generally means traders buy at support or sell at resistance, anticipating that the historical reaction at that level will repeat itself once again on this particular occasion as well, across most markets.
Confirmation often comes from candlestick patterns such as a bullish reversal candle at support or a bearish reversal candle at resistance, both suggesting a meaningful shift in short-term price momentum overall, for traders watching closely.
Specific formations like a hammer, pin bar, or engulfing pattern are commonly referenced examples, though no single candle ever guarantees the anticipated reversal will actually materialize as expected on the chart, across many different markets.
Breakout Strategy
A resistance breakout or support breakdown occurs when price decisively moves through a previously respected level, often signaling a meaningful shift in the underlying balance between buyers and sellers in that market, for active traders.
Traders typically look for breakout confirmation through strong momentum and expanding participation before committing, since not every push through a level results in sustained follow-through afterward on the following sessions, across most major markets today.
A retest entry approach waits for price to return to the broken level before entering, while confirming volume breakout conditions helps separate genuine moves from short-lived false signals in the market, under most market conditions.
Placing Stop-Loss and Take-Profit Around Key Levels
Placing a stop-loss beyond support or a stop-loss beyond resistance gives a trade room to breathe while still protecting capital if the underlying level genuinely fails to hold as expected, for traders analyzing price charts.
A sound risk-reward ratio compares the distance to the stop against the distance to the profit target, helping traders judge whether a setup is genuinely worth pursuing before committing any capital, across most trading sessions.
Traders commonly set a target next resistance level above an entry, or the next support level below a short entry, using existing chart structure to define clear and realistic trading objectives, for traders reading charts.
Worked Example: A Full Support and Resistance Trade Walkthrough
Consider a purely hypothetical example trade used for illustration only. Suppose a chart shows a well-tested horizontal level acting as support after several prior touches recorded over the past few recent weeks, across many timeframes.
In this hypothetical chart scenario, a trader might frame an entry price stop target structure conceptually: entry near the level, a stop placed just beyond it, and a target set near the next resistance, reliably.
This kind of numeric example is meant purely to illustrate structure and process, not to suggest any particular trade, price, or outcome, and should never be interpreted as financial guidance of any kind, across sessions.
Common Mistakes and Limitations of Support and Resistance Analysis
Even experienced traders fall into predictable traps. A false breakout, sometimes called a fakeout, remains one of the most common frustrations encountered when actively trading around key, well-watched chart levels, for traders working across timeframes.
Subjectivity in technical analysis is another recurring issue, since two traders looking at the identical chart can draw meaningfully different lines depending entirely on their personal method and preferred trading timeframe, for traders watching closely.
Over-reliance on support resistance without considering broader context can lead to poor decisions, particularly during a sudden whipsaw where price swings sharply in both directions within a very short period, across most major markets today.
Drawing too many lines creates visual clutter and analytical confusion, making it harder to distinguish genuinely significant levels from minor, low-value price fluctuations that carry very little real meaning overall, for traders analyzing price charts.
Confirmation bias compounds these issues further, as traders may unconsciously favor chart interpretations that support a position they already want to take rather than pursuing a genuinely objective reading of price, across many different markets.
False Breakouts (Fakeouts)
A false breakout occurs when price briefly moves beyond a level before reversing sharply, trapping traders who entered expecting continuation in the direction of the apparent breakout that ultimately failed to hold, for seasoned traders.
This pattern is sometimes described using a bull trap or bear trap, terms describing situations where an anticipated breakout instead reverses violently against the position just taken by unsuspecting traders, for traders working across timeframes.
Some fakeouts result from a deliberate stop hunt, where price briefly pushes beyond a level specifically to trigger clustered stop orders before reversing sharply, though a simple wick beyond level can also occur naturally, consistently.
Subjectivity — Why Two Traders Draw Different Lines
Because chart reading involves visual judgment, subjective analysis naturally produces variation. Two traders using identical price data can still arrive at noticeably different support and resistance conclusions about the same chart, under most market conditions.
Arbitrary lines sometimes emerge when a trader forces a level onto the chart to match a desired outcome, a tendency closely related to the broader confirmation bias discussed earlier in this article, in most cases.
Overfitting chart lines to match every minor price fluctuation reduces the usefulness of the analysis, since a level that explains everything in hindsight often predicts very little going forward in practice, across most trading sessions.
Support and Resistance Is Not Foolproof
There is no guarantee that any given level will hold, regardless of how many prior touches or how much timeframe confluence appears to support that particular price zone on the chart, for traders reading charts.
Technical analysis deals in probability not certainty, meaning traders should think in terms of favorable odds rather than assured outcomes whenever they act on a given support or resistance signal, across most major markets today.
For this reason, most experienced traders combine with other indicators and treat sound risk management as a necessity, not an optional add-on to their overall trading process or daily routine, for traders analyzing price charts.
Support and Resistance Across Different Markets
The core logic behind stocks support resistance applies broadly across asset classes, since the underlying psychology of buyers and sellers reacting to memorable prices remains fundamentally consistent everywhere in global markets, for traders watching closely.
In forex support resistance analysis, round numbers and prior session highs and lows often play an outsized role, given the continuous, around-the-clock nature of currency trading across global sessions worldwide, for traders working across timeframes.
Crypto support resistance can behave more erratically due to thinner order books and a retail-heavy participant base, producing sharper reactions and more frequent false breakouts than in older, more established financial markets, across most markets.
These asset class differences stem largely from volatility differences and liquidity differences between markets, which affect how cleanly a level holds and how quickly it can be overrun entirely by traders, across many different markets.
Despite these variations, the underlying concept transfers well across stocks, forex, commodities, and crypto, making support and resistance one of the more universally applicable tools in all of technical analysis, across most major markets today.
Frequently Asked Questions
What is the difference between support and resistance?
Support is a price floor where historical buying pressure has tended to outweigh selling pressure, while resistance is a price ceiling where selling pressure has tended to outweigh buying.
How do you calculate support and resistance levels?
Traders typically identify levels manually from swing highs and lows (see Section 4.1), apply standard pivot points formulas based on the prior high, low, and close, or use Fibonacci retracement levels for corrective zones.
What happens when support or resistance breaks?
A broken level often triggers role reversal (see Section 1.3), becoming the opposite type of level afterward. Traders distinguish a genuine breakout from a false breakout by checking volume and follow-through confirmation.
How many times does a level need to be tested to be considered valid?
There is no fixed rule, but two or more touches is a common baseline (see Section 5.1). More touches generally increase perceived reliability, though repeated rejection can also raise the odds of eventual failure.
Can support and resistance levels fail?
Yes. No level is guaranteed to hold. False breakouts happen regularly, which is why technical analysis is best treated as a probability, not certainty tool rather than a source of guaranteed outcomes.
What is the best timeframe to identify support and resistance levels?
Higher timeframes like the daily chart and weekly chart generally produce more reliable levels than very short intraday charts. Levels confirmed across multi-timeframe confluence (see Section 5.2) tend to carry extra weight.
Are support and resistance levels the same as pivot points?
Not exactly. Pivot points are one specific mathematical method for calculating support and resistance, including standard, Fibonacci, and Denmark variants, rather than a separate concept from support and resistance itself.
Do support and resistance levels work in all markets (stocks, forex, crypto)?
Yes the underlying concept applies universally because it stems from supply and demand psychology. However, volatility differences and liquidity differences across asset classes affect how cleanly levels tend to hold.