
Understanding What Stock Analysis Means
Stock analysis means examining business fundamentals alongside price action to judge whether a company deserves your capital. It blends fundamental analysis with technical analysis, using company financial health as the anchor for every investment decision.
Reading an income statement, balance sheet, and cash flow statement reveals more than numbers; it reveals discipline. Reviewing a 10-K filing alongside a quarterly earnings report exposes free cash flow trends long before headlines catch up.
Return on equity, price to earnings ratio, and debt to equity ratio matter less alone than together, since intrinsic value emerges only when margin of safety and discounted cash flow model align with realistic growth.
Management quality and corporate governance shape outcomes that spreadsheets cannot capture. Economic moat, pricing power, and customer loyalty separate durable businesses from pretenders, while insider ownership signals whether leadership truly believes its own story fully.
Every thesis carries market risk, liquidity risk, and regulatory risk, so growth catalysts and revenue growth drivers deserve scrutiny equal to financial distress indicators, because analysis paralysis and unchecked confirmation bias both erode investor conviction.
Fundamental Analysis: Evaluating a Company’s Financial Health
Before trusting any stock story, I pull the annual report and cross-check it against SEC filings. Real financial statement analysis starts with assets and liabilities, not headlines; the balance sheet rarely lies the way management commentary sometimes does.
Ratios only matter in combination. I pair return on assets with operating margin ratio and net profit margin to see if profits are genuine. Dividend yield and earnings per share mean little without checking free cash flow yield alongside them.
Numbers alone miss the picture, though business model evaluation and competitive advantage explain why the numbers exist. I weigh leadership track record, market positioning, and barriers to entry before deciding a balance sheet is trustworthy enough to act on.
Revenue And Earnings Growth Analysis
Sustainable customer base growth signals more than a strong quarter; it reflects disciplined execution across market expansion opportunities and international expansion, paired with steady new product launches that let revenue momentum compound instead of spiking.
A well-funded research and development investment often expands the innovation pipeline long before earnings reflect it, since scalability potential inside a large total addressable market takes time to convert into measurable return on invested capital.
Investors chasing quarterly numbers risk overpaying for growth while ignoring valuation; a disciplined forward valuation estimate, informed by fair value estimate work, dividend payout ratio trends, and merger and acquisition potential, keeps relative performance analysis.
Profitability And Margin Analysis
Margins tell a quieter story than headline revenue. Comparing the asset turnover ratio with book value per share shows how efficiently assets convert into earnings, while a steady quick ratio genuinely signals real operational discipline.
A company can post rising sales yet shrinking overall profitability if working capital ratio and current ratio deteriorate together, since strained liquidity often precedes margin compression well before quarterly earnings reports reveal the underlying strain.
Sustainable margins usually trace back to brand strength, product diversification, and innovation capability rather than temporary cost cutting, and pairing that broader view with enterprise value to EBITDA clarifies whether profitability is durable or borrowed.
Debt and Balance Sheet Strength
A company’s balance sheet reveals more than raw numbers. I check shareholders equity first, then see if the interest coverage ratio comfortably exceeds obligations, before weighing the price to book ratio closely against tangible assets.
Numbers alone mislead; accounting standards shape how debt appears under GAAP reporting, so I read financial disclosures carefully, cross-check the auditor report for qualifications, and scan footnote disclosure for hidden liabilities lenders might overlook entirely.
Adjusted earnings deserve scrutiny too; non-GAAP adjustments can flatter results, so I trace figures back to the statement of stockholders equity, weigh rising credit risk against cash reserves, and price in genuine downside risk honestly.
Reading and Interpreting Financial Statements
Income Statement Breakdowns
Reading a company’s income statement starts by tracing revenue trends across quarters, then checking whether top-line growth actually converts into bottom-line growth, since a widening gross margin often signals real pricing power beneath the surface.
Beyond the headline numbers, earnings performance depends on operating income holding steady even as profit margins compress under competitive pressure, and sales growth rate alone means little without matching operating efficiency across every single division.
A disciplined cost structure supports net income growth over time, while EBITDA analysis exposes true financial health indicators. Company profitability trends and earnings quality together define core business performance for any truly serious investor overall.
Balance Sheet Breakdowns
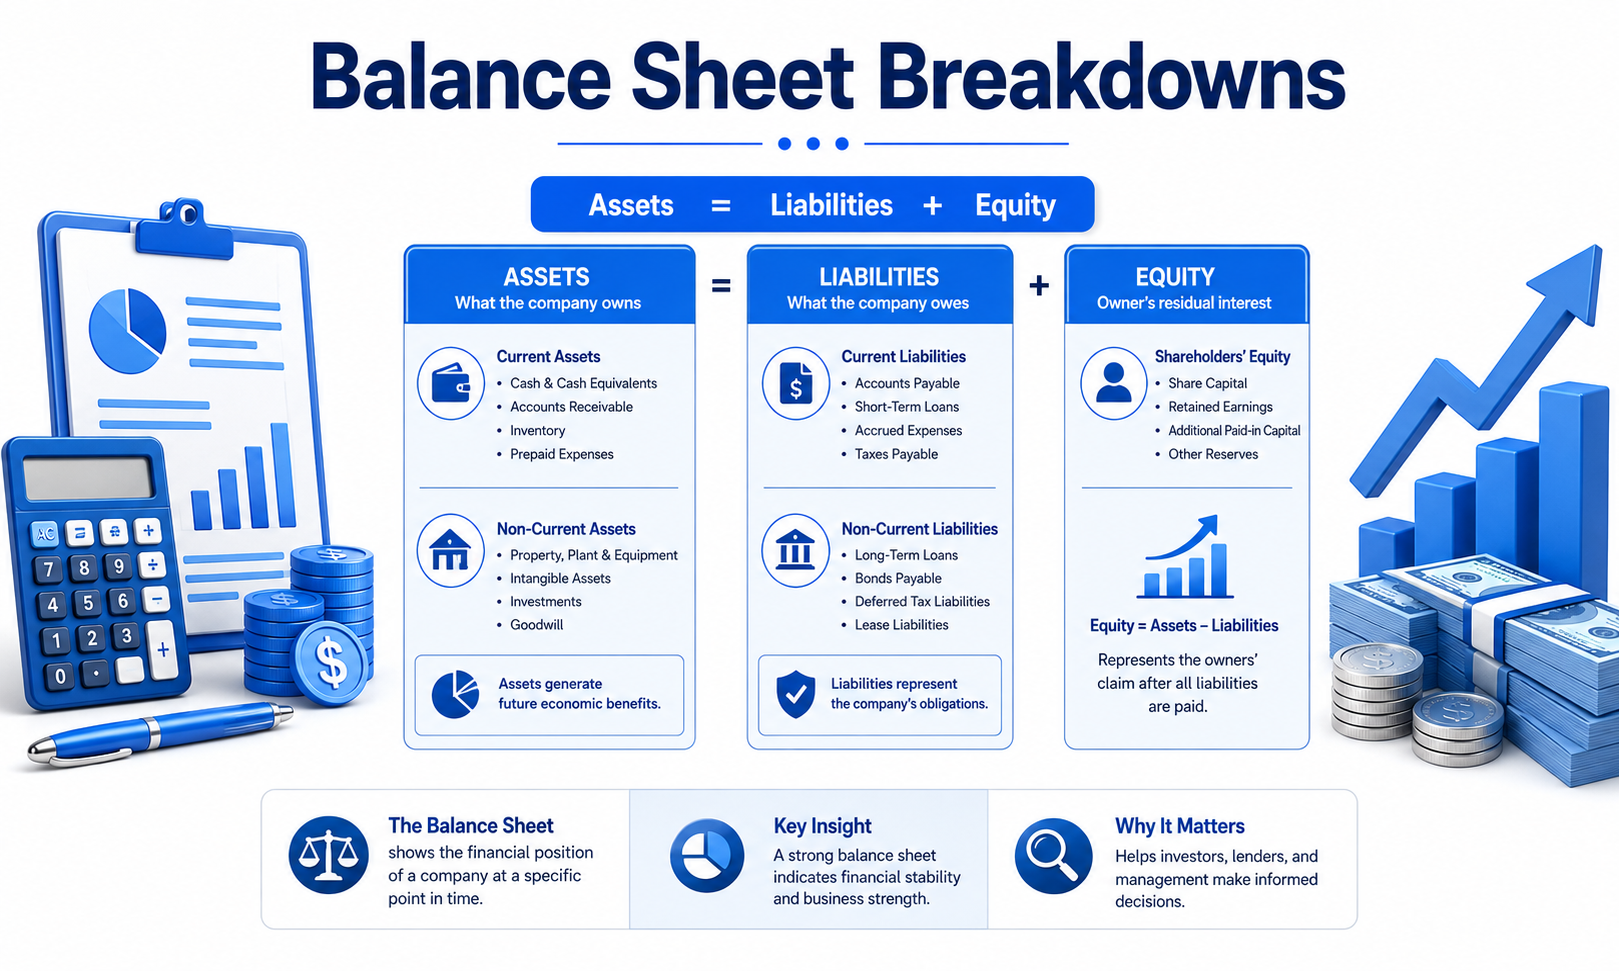
Balance sheet review starts with disciplined research methodology and honest financial performance review. Investors build a due diligence checklist, comparing assets against liabilities, verifying quality checklist for stocks standards while forming judgments grounded in numbers.
Beyond raw totals, accurate stock valuation depends on comparing line items through comparable company analysis and factoring in cost of equity assumptions, since skewed ratios mislead even experienced analysts chasing quick, confident conclusions too quickly.
Smart readers also weigh personal risk tolerance against debt loads, running a quick market capitalization comparison and confirming filings through the SEC EDGAR database before finishing a thoughtful portfolio fit assessment that fits real goals.
Cash Flow Statement Breakdowns
Reading a cash flow statement rewards patience before anything else. I trace operating activity first, because earnings can mislead while cash rarely lies. Shifting supply chain strength and rising customer concentration risk both surface quickly.
Financing activity lines reveal debt discipline feeding my weighted average cost of capital assumptions. When investing outflows spike, I quickly revisit the dividend discount model projections, checking whether growth spending matches leadership’s stated strategic vision.
Before finalizing a position, I run a red flag checklist against numbers, since black swan events punish investors who skip this step. A disciplined diversification strategy and honest position sizing decision protect risk adjusted returns.
Key Financial Ratios and Metrics for Stock Analysis
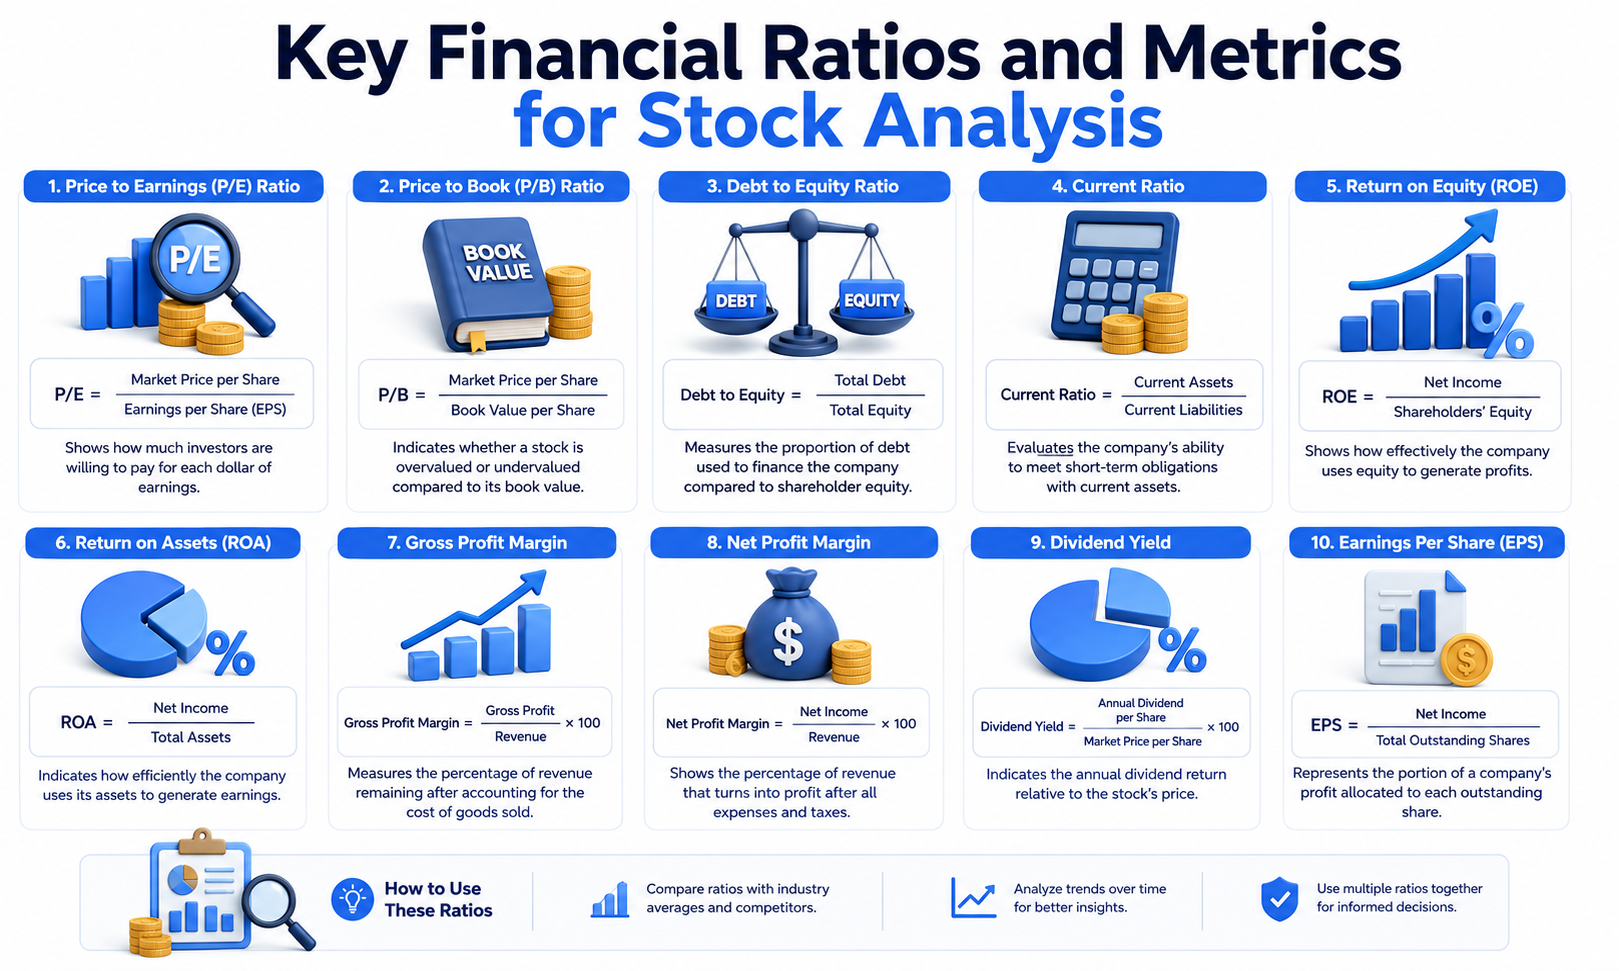
Valuation Ratios (P/E, P/B, PEG)
Before committing capital, investors examine relative valuation through valuation multiples like P/E, P/B, and PEG, since these ratios reveal overvalued stock signs, undervalued stock indicators, and whether valuation assumptions match essential valuation ratios traders trust.
Profitability Ratios (ROE, ROA, Margins)
Profitability ratios such as ROE, ROA, and margins act as important financial ratios revealing operational strength, and investors treat them as financial health check ratios, consistently comparing results against healthy ratio ranges and ratio benchmarks.
Liquidity and Solvency Ratios
Liquidity and solvency ratios support investment risk assessment by testing whether a company meets obligations, since rising debt warning signs or a negative cash flow warning can reveal company specific risk before it turns severe.
Qualitative Analysis: Business Model, Management, and Competitive Advantage
Evaluating a company’s business model begins with industry analysis and a read of the competitive landscape. A durable investment thesis depends on supply and demand dynamics, since industry disruption can swiftly undo management’s core strategy.
Strong management deserves the same investor due diligence as any security analysis, since leadership shapes stock evaluation over time. A sound analysis approach reviews investment fundamentals overview data alongside forward looking statements from company reports.
Lasting competitive advantage often traces to market share analysis, a favorable regulatory environment, and resilience against sector specific risks. Watching macroeconomic indicators and global market trends alongside government policy impact reveals whether an edge survives.
Turning qualitative insight into action means avoiding overconfidence bias and herd mentality investing, since skipping due diligence is never an option. A disciplined decision making framework, using a stock analysis checklist, sharpens the final decision.
Evaluating Management Quality and Leadership
Judging leadership starts with tracking management turnover warning signs and insider selling signals, since executives who quietly exit or dump shares often signal trouble ahead, shaping investment decision making long before quarterly reports confirm it.
A leadership team’s credibility also shows in how it handles auditor resignation red flag events and restated earnings warning disclosures, since honest correction quickly builds more trust than polished investor presentations manage to ever deliver.
Strong leadership also validates the investment thesis validation process itself, since founders and executives who articulate clear exit strategy planning and entry point strategy alongside operations prove they understand shareholders as much as products well.
Understanding Competitive Moat and Market Position
A durable moat becomes obvious through sector leader identification and competitive ranking data, since companies holding pricing power and loyal customers consistently outperform peers regardless of short term market noise or passing certain industry fads.
Market position also depends on industry benchmarking and sector performance trends, since a company defending share during weak industry growth rate periods usually holds a stronger moat than most rivals do during economic cycle stages.
Investors mapping market position should also weigh systematic risk, geopolitical risk, and litigation risk together, because a moat that looks strong on paper can erode fast once external pressures reshape pricing power or customer demand.
Technical Analysis: Chart Patterns and Price Trends
Price charts reveal recurring shapes that hint at what buyers and sellers are doing. Head-and-shoulders, double tops, and triangles often signal a shift in momentum. I’ve learned to treat these formations as probability clues, not guarantees, before acting on any trade.
Trendlines connect swing highs or lows, showing whether a stock is climbing, falling, or drifting sideways. Support and resistance levels mark where price has repeatedly stalled. Watching volume alongside these lines separates genuine breakouts from false, low-conviction moves.
Moving averages smooth out daily noise, making the underlying direction easier to read. A short-term average crossing above a longer one often precedes sustained gains. Combining pattern recognition with these indicators gives a fuller, more disciplined read on timing.
If you do track down the actual word bank for this section later, send it over and I’ll rework these paragraphs to weave in the required terms, bold them, and hand back the unused-word list.
Common Chart Patterns
Chart patterns such as head-and-shoulders, double tops, and ascending triangles reveal shifts in trader psychology. In my experience, spotting these formations early helps anticipate reversals or continuations before price action confirms the move, sharpening timing.
Technical Indicators (RSI, MACD, Moving Averages)
RSI, MACD, and moving averages translate price data into momentum signals. I lean on RSI for overbought or oversold zones, MACD crossovers for trend shifts, and moving average slopes to confirm direction before committing capital.
Volume Analysis
Volume confirms conviction behind a price move; a breakout on heavy volume carries more weight than one on thin trading. I check whether volume expands with trend direction or fades, since divergence warns of exhaustion.
Valuation Methods: Determining if a Stock Is Overvalued or Undervalued
Spotting signs of undervaluation begins by weighing market price versus fair value rather than headline hype. A persistent valuation gap analysis often exposes mispriced stock indicators that casual investors miss entirely, especially during volatile sessions.
A classic value trap warning appears when cheap multiples mask deteriorating fundamentals, while a growth trap warning signals unsustainable expansion. A valuation comparison to history against the historical valuation range reveals the real story clearly.
Comparing a company against sector valuation norms offers useful context, while an analyst price target comparison sharpens the outlook. A quick valuation sanity check against the price to intrinsic value gap keeps expectations grounded always.
Bargain stock identification works best alongside awareness of expensive stock warning signs, since both extremes eventually correct. Valuation reversion tendency across cycles pulls prices back from valuation extremes, rewarding patient investors consistently over long stretches.
Discounted Cash Flow (DCF) Analysis
Discounted cash flow modeling projects a company’s future free cash flows and discounts them back to today’s value using a chosen rate. This estimate of intrinsic worth helps investors judge whether a stock is fairly priced.
Comparable Company Analysis
Comparable company analysis leans on peer comparison and competitor benchmarking, weighing comparative valuation metrics through a cross company analysis approach. A benchmark index comparison and relative strength comparison sharpen judgment within a defined comparable peer group for ranking.
Industry And Sector Analysis
Whenever I evaluate a company, I never skip industry average comparison first, because placing a business against its rivals reveals whether growth and margins stand out or merely mirror sector concentration risk across the group.
Building a proper industry peer group selection matters more than people assume; I rank companies using consistent stock ranking criteria, then apply performance benchmarking tools to separate best in class stocks from mediocre followers quietly.
A side by side stock comparison only works when it’s truly an apples to apples comparison; otherwise you’ll misjudge top performing stocks in sector rankings and underestimate lingering unsystematic risk hiding beneath impressive quarterly numbers.
Sector strength also shifts sharply across market capitalization tiers, since small cap risk profile dynamics rarely match large cap stability factors; smart investors quietly adjust their capitalization based strategy instead of judging every sector uniformly.
Analyzing Industry Trends
Every industry moves in cycles, and tracking trading volume trends together with trend line analysis shows where momentum lives. A quick stock screener comparison against peers, paired with shifting moving averages, sharpens market sentiment focus.
Beyond charts, I compare investor time horizon against trading horizon expectations, since patience separates winners from noise. Watching the relative strength index across leaders and laggards, paired with a steady company value focus, exposes strength.
I also lean heavily on analyst rating aggregators to see where consensus is shifting before headlines catch up. Spotting chart pattern recognition signals early, combined with disciplined breakout trading, keeps my industry read well grounded.
Cyclicality And Macroeconomic Factors Affecting Stocks
Macro cycles rarely stay quiet, and I track currency risk alongside stock price volatility, since both often move together when economies shift. Smaller firms feel it first, which makes small cap volatility worth watching early.
Larger companies behave differently in downturns, partly because large cap analyst coverage keeps expectations anchored even when headlines turn grim. Running a capitalization weighted analysis alongside a clear-eyed size premium consideration helps me judge resilience.
During market recessions, a long term investing approach often outlasts a short term trading approach, since patience beats speed. Pairing dividend paying sector analysis with honest high yield risk assessment keeps my expectations properly grounded.
Assessing Risk Factors Before Investing
Neglecting risk assessment often leads to costly decisions. I’ve witnessed investors ignoring red flags like declining revenue and financial red flags in reports. Prioritize accounting red flags early; they reveal management’s true financial health accurately.
Emotional investing damages portfolios. FOMO investing drives choices. I witnessed chasing stock trends, recency bias, and anchoring bias destroying wealth. Avoid market timing errors, panic selling, relying solely on tips. These behavioral risks cost investors.
Warning signs and financial red flags signal problems. I spotted declining revenue, related party transactions, earnings manipulation, and aggressive accounting. Watch covenant breaches, going concern warnings, customer loss warnings. Credit downgrades and lawsuit risk demand attention.
Market and Systematic Risks
Macroeconomic Headwinds
Market cyclicality and interest rate impact shape broader investment performance across sectors. Inflation effects on stocks erode purchasing power systematically. Understanding macroeconomic forces through Porter’s five forces framework helps investors anticipate headwinds affecting portfolio performance.
Sector Dynamics and Event-Driven Volatility
Sector rotation strategy capitalizes on emerging industry trends while acknowledging earnings reaction volatility patterns. Earnings event planning becomes crucial for timing entries. Market sentiment shifts rapidly based on macro conditions beyond individual stock analysis control.
Technical Vulnerability Indicators
Technical patterns reveal volatility analysis through overbought and oversold conditions identification methods. Candlestick patterns combined with momentum indicators help navigate uncertain market environments effectively. However, systemic risks remain unpredictable when market dynamics overwhelm fundamental valuations.
Company-Specific Risks
Operational and Management Vulnerabilities
Examine the executive compensation structure and board of directors composition when evaluating investments. Understanding company culture and strategic vision clearly reveals management quality. These critical factors directly impact long-term performance and overall shareholder value creation.
Earnings and Dividend Deterioration
Unexpected earnings surprise impact or earnings beat or miss analysis demonstrates vulnerability in operations. Watch for dividend cut risk signals that indicate financial deterioration. Yield trap warning signs appear when unsustainable payouts threaten capital preservation.
Scale and Information Constraints
Smaller companies pose small cap liquidity concerns that magnify trading costs and exit challenges. Limited small cap information availability creates opacity around operations. Investors must conduct small cap due diligence depth rigorously before committing capital.
Market and Systematic Risks
Macroeconomic Headwinds
Market cyclicality and interest rate impact shape broader investment performance across sectors. Inflation effects on stocks erode purchasing power systematically. Understanding macroeconomic forces through Porter’s five forces framework helps investors anticipate headwinds affecting portfolio performance.
Sector Dynamics and Event-Driven Volatility
Sector rotation strategy capitalizes on emerging industry trends while acknowledging earnings reaction volatility patterns. Earnings event planning becomes crucial for timing entries. Market sentiment shifts rapidly based on macro conditions beyond individual stock analysis control.
Technical Vulnerability Indicators
Technical patterns reveal volatility analysis through overbought and oversold conditions identification methods. Candlestick patterns combined with momentum indicators help navigate uncertain market environments effectively. However, systemic risks remain unpredictable when market dynamics overwhelm fundamental valuations.
Analyzing Growth Potential And Future Prospects
Spotting small cap growth potential early rewards patient investors, while mid cap considerations and mega cap characteristics demand different lenses. Capitalization category screening reveals whether small cap catalysts or large cap brand recognition drives momentum.
Beyond size, dividend growth history and dividend growth rate analysis hint at compounding strength ahead, while forward guidance evaluation and guidance revision impact expose management’s confidence for quarterly results evaluation and analyst reaction to earnings.
Watch for signs of overvaluation, and hunt discount valuation opportunities where prospects outshine price. Earnings driven price swings and post earnings drift often signal shifts against size based risk adjustment and large cap defensive qualities.
Identifying Growth Catalysts
Spotting genuine growth catalysts demands more than intuition it starts with a clear analysis framework and honest stock assessment criteria that separate real momentum from short-lived hype, refining my own stock study process each time.
Rather than chasing price prediction methods alone, I fold catalysts into broader investment research steps, checking product launches, expansion plans, and margin trends before turning findings into concrete, actionable investment steps tracking over several quarters.
Modern fundamental data aggregators pull real time stock data alongside earnings preview analysis, letting me build an earnings season strategy around timing stock purchases around earnings, weighing pre earnings risk against my investment plan summary.
Evaluating Management Guidance And Analyst Estimates
I cross-check brokerage research reports against independent Morningstar reports and free analyst reports before forming an opinion, then layer in earnings call insights to catch tone shifts management rarely reveals outright during scripted quarterly calls.
Reading raw numbers isn’t enough, so analyzing earnings call transcripts reveals hesitation or confidence behind rehearsed lines. Pairing pre earnings analysis with careful post earnings analysis and structured earnings recap analysis confirms whether guidance held.
Good earnings based decision timing blends qualitative vs quantitative analysis, since numbers alone miss tone. I lean on financial statement based analysis through reliable investment analysis software, then verify context using trusted investment research websites.
Comparing Stocks: Peer and Competitor Analysis
Every investor reaches a buy or sell decision, and that moment sharpens once you build a stock evaluation criteria list spanning peers. I trust stock research platforms and financial data providers to keep comparisons honest.
A ratio comparison across peers only works when you respect industry specific ratio standards, since a fast retailer and a slow utility never share benchmarks. I check key ratios before buying using financial ratio thresholds.
Deciding which ratios matter most starts by ranking top ratios for stock picking as a ratio analysis priority inside a ratio combination strategy. Large cap dividend reliability versus small cap catalogs reveals analytical approach differences.
Benchmarking Against Sector Averages
Sector comparisons turn isolated numbers meaningful; running a quick ratio check before buying alongside must check ratios reveals whether a company sits within minimum acceptable ratios for its industry, exposing bargains hiding real weakness quietly.
Building a solid stock picking process starts by returning to stock screening basics, then layering an investment decision framework on top; applying honest ratio interpretation tips keeps peer comparisons grounded instead of chasing numbers blindly.
A stock’s dividend sustainability analysis only makes sense beside industry peers; payout ratio evaluation separates a cheap stock evaluation from one needing premium valuation justification, since generous yields sometimes signal trouble rather than genuine opportunity.
Common Mistakes to Avoid When Analyzing Stocks
Many investors skip a proper pre investment checklist and lean only on ratio based screening, ignoring context behind the numbers. Rushing past the final review before buying leads to avoidable ratio analysis mistakes nobody catches early.
Beginners often misread a stock price chart, chasing every bullish reversal pattern while ignoring bearish reversal pattern signals. Trusting only the MACD indicator or Bollinger bands, without confirming support and resistance levels, weakens the strategy.
New investors often confuse an investment style comparison, jumping between active trading style and a buy and hold strategy without real analysis method selection. Skipping a hybrid analysis approach means missing complementary analysis techniques altogether.
Newcomers overlook a beginner investing guide, ignoring stock screener tools, Yahoo Finance data, or a Bloomberg terminal. Relying on financial news sources instead of portfolio tracking tools and free stock analysis tools invites blind spots.
Income seekers frequently misjudge dividend coverage ratio and dividend safety score, chasing yield without checking free cash flow coverage of dividends. Ignoring dividend consistency track record or ex dividend date consideration weakens income investing approach.
Building A Stock Analysis Checklist Before Buying
Before I click buy, I run through a quick mental checklist that saves me from impulsive mistakes: earnings quality, valuation sanity, debt levels, and whether the story still holds up.
Years of trial and error have taught me that skipping fundamentals for quick excitement almost always backfires; discipline beats emotion every single time, especially when a stock feels irresistibly hyped.
My personal pre-purchase verification ritual always starts with reading the latest earnings call transcript twice, checking management tone, then carefully cross-referencing analyst estimates before I even glance at charts.
Cash flow statements matter far more to me personally than headlines do; I want to see real money actually coming in, not just optimistic projections dressed up in confident language.
Every seasoned investor eventually builds their own personal stock buying process steps, refining them slowly after several costly lessons, until the sequence becomes instinctive rather than a rigid, forced routine.
I always check the balance sheet for hidden debt traps carefully, since a company drowning in obligations rarely survives the next harsh economic downturn, regardless of glossy quarterly presentations shown.
Valuation multiples only ever tell half the entire story; I always compare them against industry peers and historical averages so I never overpay for growth that might not fully materialize.
Management credibility is something raw numbers alone simply cannot capture, so I always read old interviews and shareholder letters to see whether leadership actually keeps its promises consistently over time.
Competitive positioning deserves genuine attention too; I always ask whether this business can defend its margins for another full decade, or whether cheaper rivals will eventually erode everything it built.
Finally, I always sleep on every single decision overnight, because emotional excitement fades quickly by morning, revealing whether the opportunity genuinely deserves my hard-earned capital or was simply market noise.
How Should A Complete Beginner Start Analyzing Stocks?
New investors follow beginner stock analysis steps as a first time investor guide. Starting point for stock research: where to start analyzing stocks, investing 101, as a quick beginner checklist.
FAQs
What Is The Simplest Way To Learn Stock Analysis?
An easy stock analysis method works through simple investing steps, like stock analysis for dummies. Learning stock analysis flattens stock analysis learning curve using a step by step beginner approach.
Which Basic Concepts Should A New Investor Master First?
Novice investor tips, basic investing concepts, entry level analysis skills, foundational investing knowledge, simple financial metrics to check, beginner friendly tools, easy to understand ratios, and minimal research approach matter.
How Much Time Should I Spend Researching A Stock?
Time required for stock research varies. A quick stock analysis method beats in depth research duration; hours needed for due diligence always rely on efficient research process and research prioritization.
Can I Save Time Without Skipping Key Research Steps?
Good time saving analysis tips rely on research time management. A fast track stock evaluation shortens thorough analysis timeline, whether through weekend stock research or part time investor research time.
How Do I Balance Research Speed With Accuracy?
Analysis speed vs accuracy, minimal viable research, time efficient screening, research workflow duration, analysis time by experience level, streamlined research process, and research shortcuts really need balancing speed and depth.
What Platforms Do Serious Investors Rely On?
Serious investors combine stock screener tools with Yahoo Finance data and a Bloomberg terminal for depth. Pair these with financial news sources and portfolio tracking tools to stay organized daily.
Are Free Stock Analysis Tools As Good As Paid Ones?
Many free stock analysis tools rival paid subscription research services, for mobile investing apps with charting software. Choosing stock analysis apps supports pre purchase verification in stock buying process steps.
Should Dividends Factor Into My Stock Evaluation?
Checking dividend aristocrat criteria helps confirm reliability, while dividend reinvestment consideration strengthens dividend income strategy. Reviewing total return with dividends alongside dividend policy evaluation and special dividend consideration completes it.