
What Is a Moving Average?
A moving average is a technical indicator that smooths raw, jagged price action into a single rolling average, turning scattered daily closes into one continuous trend line overlaid directly onto a price chart in practice.
Traders and analysts use it as a chart overlay because raw price bars jump around constantly, and a moving average filters that noise, revealing the underlying direction without reacting sharply to every minor daily fluctuation.
At its core, the calculation is simple: take a set number of closing prices, add them together, then divide by that count to produce the average price over time for whichever window a trader selects.
Because it relies entirely on past closing prices, analysts classify a moving average as a lagging indicator, meaning it confirms a move only after it has already begun rather than predicting exactly where price goes.
Despite that lag, it remains one of the most widely used tools in technical analysis, since it turns messy, emotional price behavior into a calmer, more readable moving average definition anyone can interpret quickly overall.
Why It’s Called a “Moving” Average
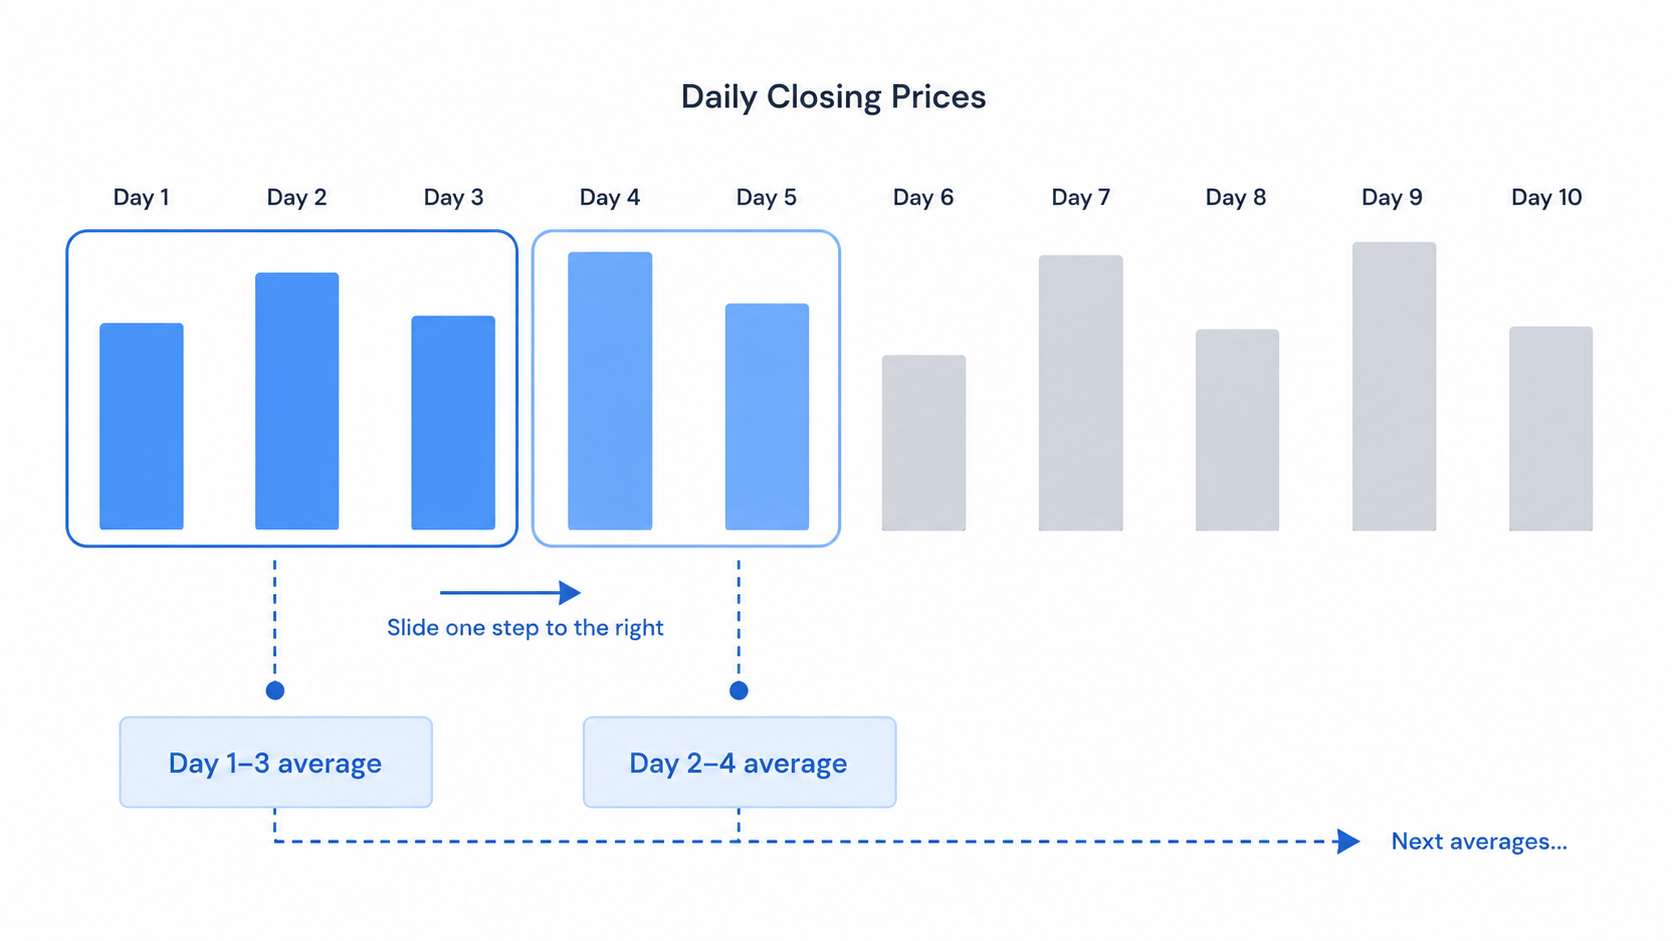
The word moving describes how the calculation constantly shifts forward through time, using a sliding window of recent prices instead of leaning on a fixed, unchanging block of historical data pulled from the past overall.
Each time a new trading period closes, the oldest price in that window drops away and the newest price steps in, a mechanical process traders often describe simply as dropping oldest and newest during recalculation.
This continuous rolling calculation produces a dynamic line that updates with every new candle on the chart, making the average feel alive rather than static, always reflecting the most recent price behavior available for traders.
What a Moving Average Is NOT (Common Misconceptions)
A common misconception treats a moving average like a crystal ball, but it is not a prediction; it cannot forecast tomorrow’s close and only summarizes what has already happened across the market up to now.
Because it is lagging not leading, the line trails behind actual price, which means sharp reversals frequently begin well before the moving average itself visibly bends to confirm that a new direction has taken hold.
Understanding the moving average vs. price forecast distinction prevents a frequent beginner error: assuming the indicator guarantees future outcomes, when in truth it only describes past, already-averaged behavior with no built-in certainty whatsoever on charts.
How to Calculate a Moving Average (Step-by-Step With Real Numbers)
Calculating a moving average formula by hand is straightforward once the underlying logic clicks, and walking through a worked example makes the whole concept far easier to grasp than reading abstract theory alone ever could.
Every moving average calculation begins with the same raw ingredient: a series of closing prices for whatever asset, timeframe, and number of periods the trader has chosen to study for that particular chart setup today.
For a manual calculation, you sum those closing prices together, then divide by number of periods to arrive at a single averaged value that represents that specific window of recent trading activity overall typically.
Most traders today lean on a spreadsheet calculation or charting software instead of doing this by hand, though grasping the underlying mechanics still matters for understanding exactly what the resulting line represents visually each session.
The two most common approaches are the SMA formula and the EMA formula, each treating historical prices quite differently, and the following two sections explore both in careful, worked-through detail for most active traders overall.
Simple Moving Average (SMA) Calculation
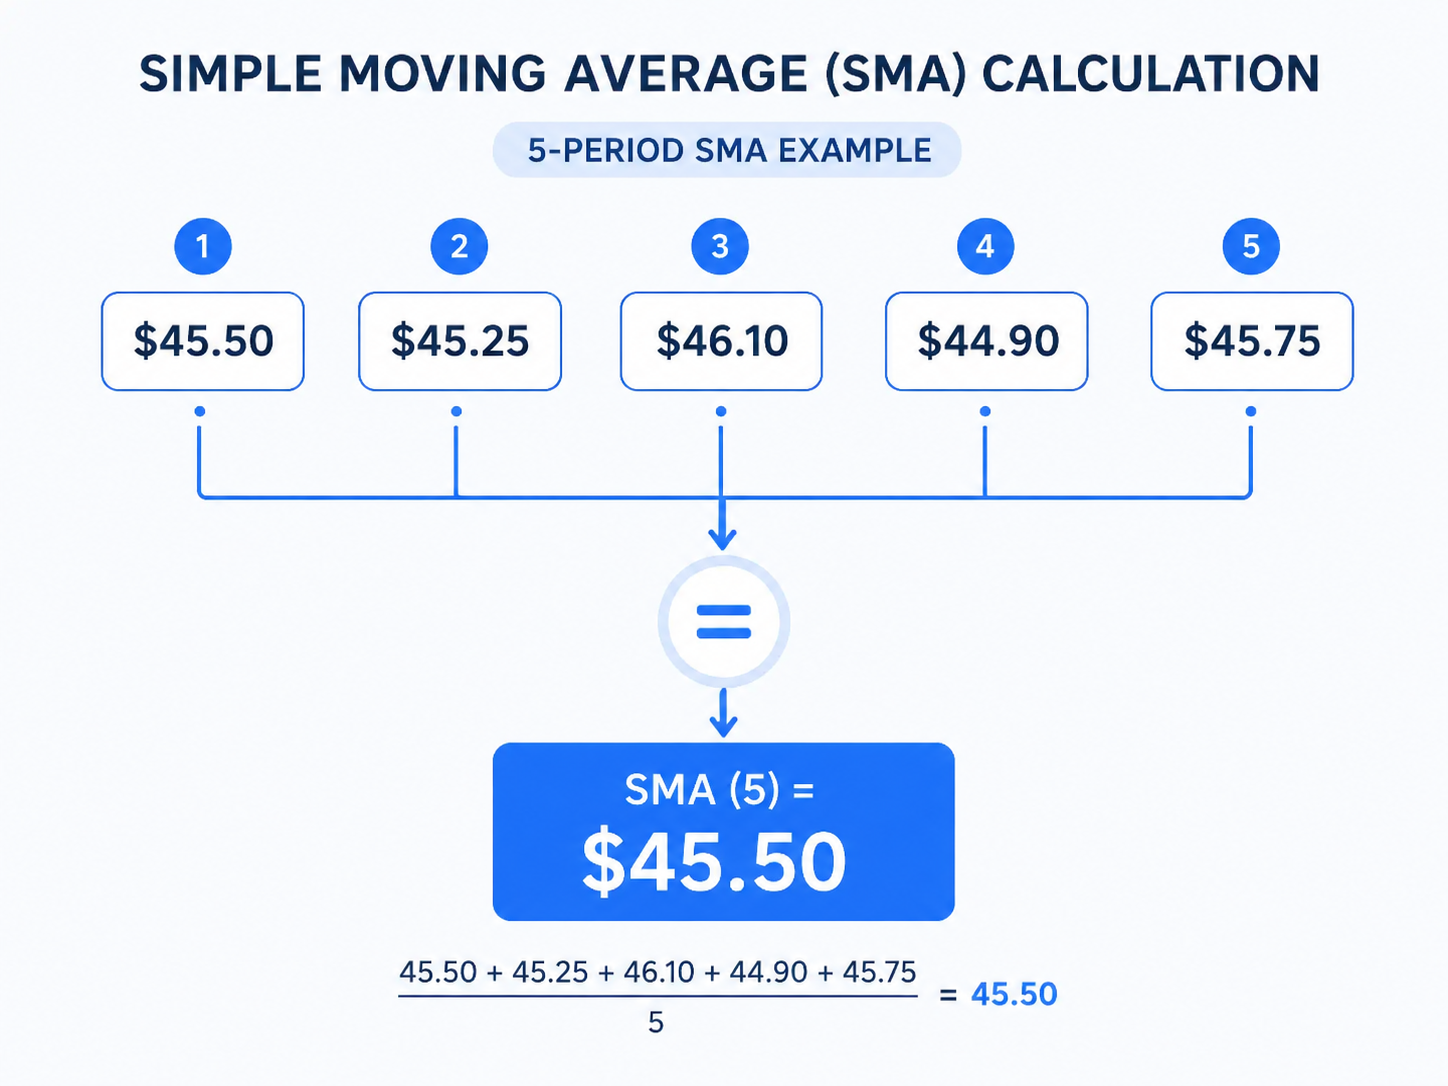
The Simple Moving Average (SMA) calculates an unweighted average by summing a fixed number of closing prices and dividing by that same count, giving every single price point identical influence over the final outcome currently.
Consider a 10-day SMA example: add together the closing prices from the last ten trading sessions, then divide the resulting sum of closing prices by ten to arrive at today’s freshly averaged value in markets.
Because every price receives equal weighting, the SMA behaves like a straightforward arithmetic mean, producing a smoother, steadier line that reacts gradually rather than jumping sharply whenever a single new trading session simply arrives today.
Exponential Moving Average (EMA) Calculation
The Exponential Moving Average (EMA) applies a weighted average that leans more heavily on recent price behavior, using a smoothing factor derived mathematically from the chosen number of periods the chart currently tracks closely today.
This exponential weighting means the newest closing prices carry more influence than older ones, letting the EMA track live price action with noticeably less delay than a comparable Simple Moving Average calculated the same way.
The core EMA vs SMA calculation difference comes down to this multiplier formula, which amplifies recent data and explains why the EMA line hugs price more tightly during fast, volatile market swings and reversals specifically.
Weighted and Volume-Weighted Moving Averages (Brief Overview)
Beyond SMA and EMA, some traders use a WMA, a linear weighted moving average that assigns progressively greater weight to more recent prices through a straightforward, predictable linear scale rather than an exponential curve usually.
A related variant, the VWMA, or volume-weighted moving average, factors trading volume into the calculation, giving heavier influence to sessions where noticeably more shares or contracts actually changed hands throughout that particular day in practice.
These less common moving average types are not essential knowledge for beginners, but knowing they exist helps explain the occasional differences seen between charting platforms and their varying default indicator settings and presets for traders.
SMA vs. EMA: Which One Should You Use?
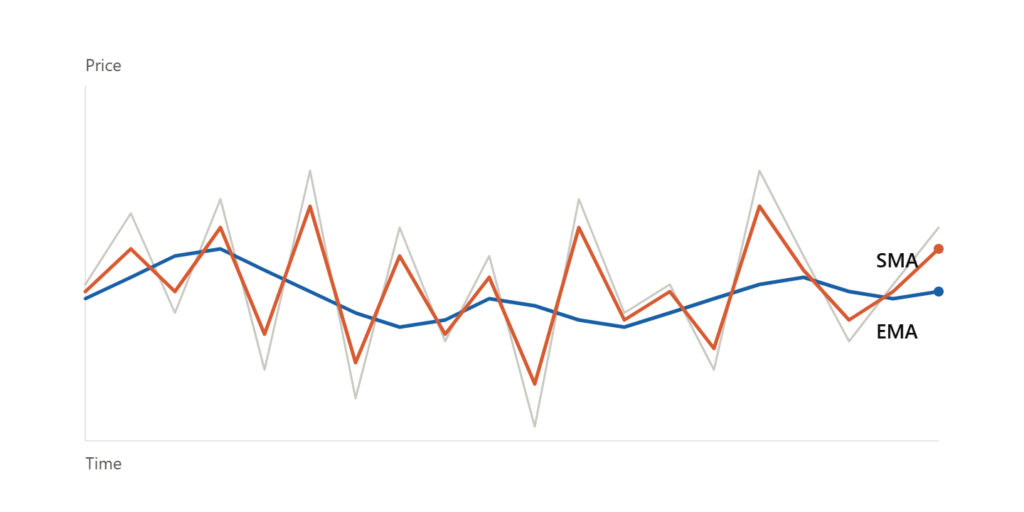
Choosing between SMA vs EMA ultimately comes down to a trade-off between smoothness and responsiveness, since each formula treats historical price data through a fundamentally different underlying mathematical approach and calculation philosophy overall on charts.
The simple vs exponential moving average debate centers on lag comparison: the SMA lags more because it weighs every price equally, whereas the EMA reacts faster to fresh, newly incoming price movement each session overall.
A smoother line vs reactive line trade-off means the SMA tends to filter short-term noise more effectively, which many traders prefer when studying broader, longer-term structural trends rather than fleeting daily price swings each session.
Meanwhile, a more reactive EMA can highlight emerging shifts earlier, though that extra sensitivity also raises the odds of reacting to temporary noise instead of a genuine, lasting change in the underlying trend in markets.
Ultimately, which moving average is better depends entirely on a trader’s timeframe, goals, and personal tolerance for noise, since neither formula proves objectively superior across every market condition, asset class, or trading style for now.
How to Choose the Right Time Period (20, 50, 100, 200-Day, etc.)
Selecting the right moving average period length shapes how an indicator behaves, since shorter windows react quickly to fresh price action while longer windows smooth price into a slower, steadier long-term picture instead in practice.
Choosing MA settings typically starts by identifying your trading horizon, because a day trading vs long-term investing approach naturally calls for very different period lengths plotted on that very same price chart for most traders.
A short-term vs long-term moving average comparison highlights the core trade-off: shorter periods track price closely but generate more noise, while longer periods lag further behind but filter that excess noise away more thoroughly today.
Common benchmarks like the 20-day moving average, 50-day moving average, and 200-day moving average exist because they represent widely recognized, broadly followed timeframe selection standards shared among most active market participants across the globe today.
The subsections below break these standard periods into short-term, medium-term, and long-term categories, explaining exactly where each one typically fits within a broader technical analysis approach to reading and interpreting price charts during live trading.
Short-Term Periods (5–20 Days)
Short-term periods, generally spanning five to twenty trading sessions, react quickly to fresh price movement, which makes them popular among traders focused on fast-moving, intraday use style trading strategies and quick entries across most markets.
A day trading moving average built on these fast-reacting settings helps identify momentum shifts within hours rather than weeks, though that same speed also produces considerably more frequent false trading signals along the way typically.
Because these shorter windows track the short-term trend so closely, traders often pair them with other confirming tools rather than relying on a single fast-moving line entirely alone when making trading decisions for most traders.
Medium-Term Periods (50 Days)
Medium-term periods, most commonly built around the 50-day MA, sit between noisy short-term settings and smoother long-term benchmarks, offering a balanced view of currently developing price structure and building market momentum overall in real markets.
This length suits swing trading, where traders typically hold positions for several days to a few weeks, requiring a line responsive enough to matter without reacting to every single minor daily price wiggle overall today.
Analysts frequently use the fifty-period setting for medium-term trend confirmation, checking whether price remains above or below it before committing to a broader, more decisive directional swing trade thesis and position sizing during live trading.
Long-Term Periods (100–200 Days)
Long-term periods, spanning roughly one hundred to two hundred trading sessions, smooth out short-term volatility almost entirely, revealing the dominant, broader long-term trend that guides an asset across many consecutive months for many active traders.
Professional analysts widely treat the 200-day moving average as an institutional benchmark, frequently referencing it when discussing whether a market currently sits within a broad bull phase or, alternatively, a genuine bear phase on charts.
These longer lines often function as major support and resistance, with price repeatedly bouncing off or struggling to break through them during extended, multi-month directional moves seen across many different financial markets worldwide over time.
How to Read and Use a Moving Average on a Chart
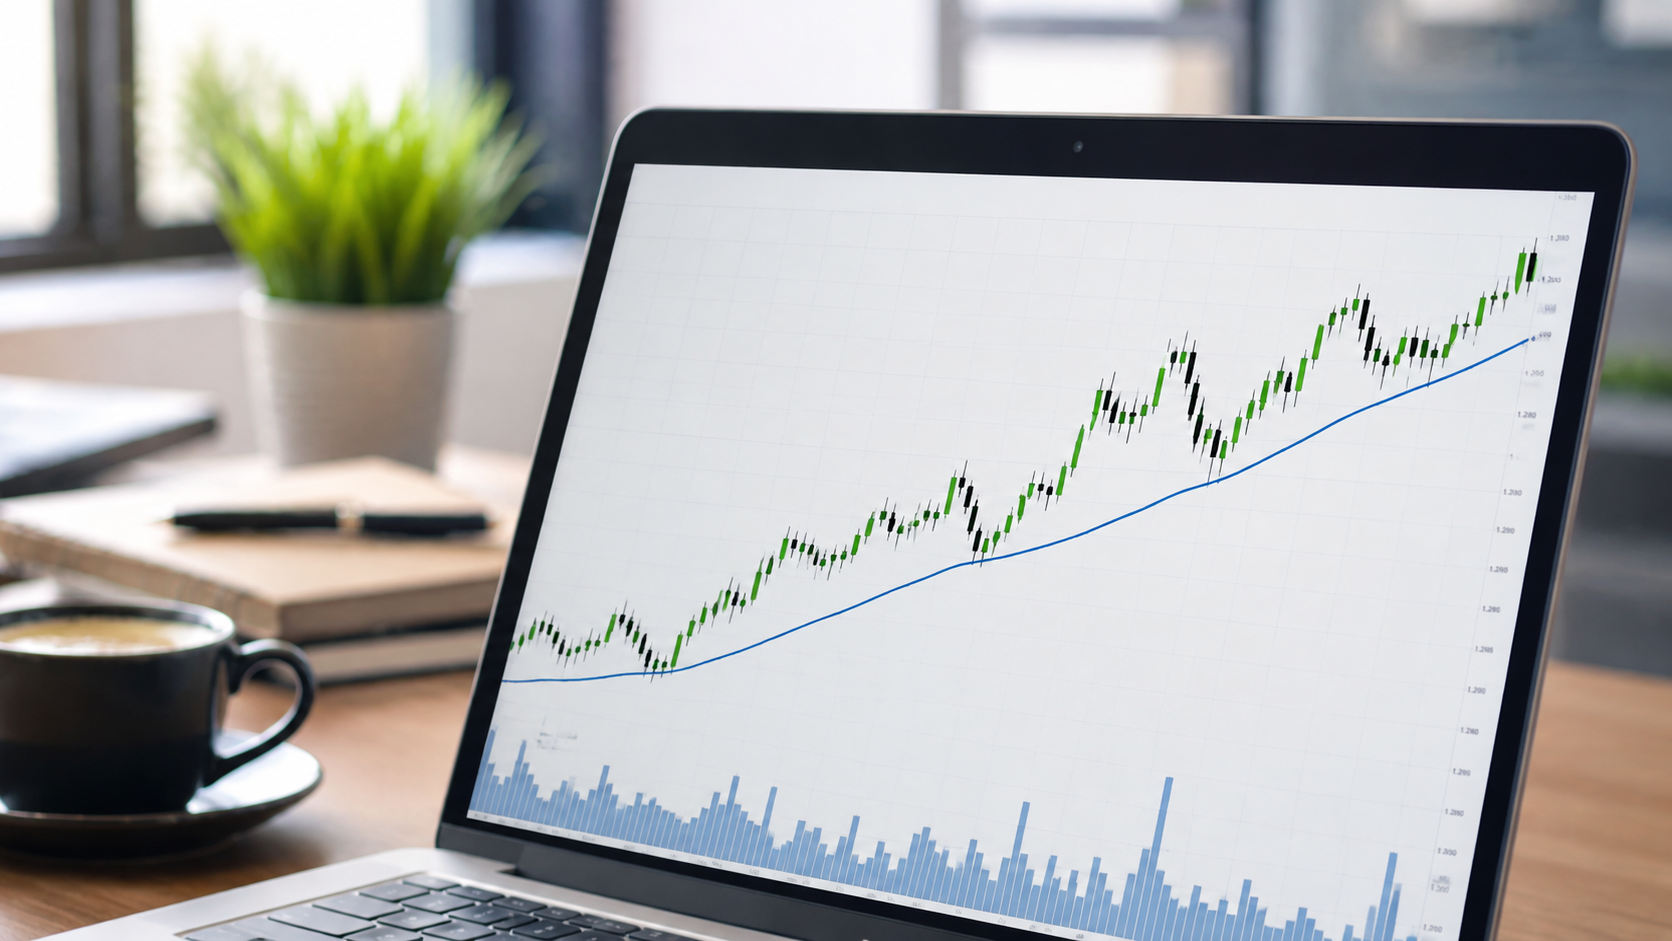
Reading moving average signals starts with a simple observation: whether current price sits above or below the line, since that basic relationship offers an immediate directional snapshot at a single, quick glance for most traders.
When price above moving average persists, it generally reflects an uptrend downtrend identification pattern favoring buyers, while sustained trading beneath the line typically points toward broader selling pressure gradually taking firmer hold in real markets.
Beyond position, the slope of moving average matters just as much; a rising line reinforces upward momentum, while a flattening or declining slope hints at weakening underlying trend strength somewhere further ahead in time generally.
Many traders also treat the line itself as dynamic moving average as support or moving average as resistance, watching for price to bounce off it during pullbacks within an already ongoing, established trend each session.
Combining position, slope, and the way price reacts at the line gives a fuller picture of trend direction than glancing at price alone, though a trader should never read any single signal in complete isolation.
Moving Average Crossovers (Golden Cross and Death Cross)
A golden cross occurs when a shorter moving average, often the fifty-period line, crosses above a longer one, typically the 200-day moving average, signaling a potential bullish shift in the broader trend during live trading.
The opposite pattern, a death cross, happens when that same shorter line crosses below the longer benchmark, often interpreted as a bearish crossover warning that weakening long-term momentum may be steadily building beneath the surface.
This MA crossover signal, built around the well-known 50-day and 200-day crossover, remains one of the most widely cited trend reversal signal patterns discussed across financial media and broader technical market analysis across most markets.
Using Multiple Moving Averages Together
Using multiple moving averages together lets traders compare short, medium, and long-term lines all at once, revealing whether momentum aligns across different timeframes or instead contradicts itself somewhere across the same chart for most traders.
Some traders informally call this a moving average ribbon, stacking several multiple MA lines of varying lengths together to visualize trend strength through how tightly or loosely those lines cluster together for most active traders.
When shorter and longer lines all point in the same direction, it supports confirming trend strength with several MAs, offering far more conviction than relying on any single isolated moving average line by itself clearly.
Limitations of Moving Averages (What Beginners Often Miss)
Every beginner eventually runs into moving average limitations, and understanding them early spares the frustration of expecting an imperfect, backward-looking tool to behave like a flawless, forward-looking forecasting system for market prices in real markets.
The most fundamental lagging indicator drawback is delay itself; because the line comes entirely from past prices, it will only ever confirm a trend after a meaningful portion of the move has already occurred today.
In choppy, directionless markets, moving averages frequently generate false signals, producing what traders call whipsaws, where price repeatedly crosses the line back and forth without ever establishing any lasting, genuinely tradable direction during live trading.
A sideways market exposes these choppy market problems most clearly, since a trend-oriented tool like a moving average struggles to provide useful clarity when price simply oscillates within a narrow, directionless trading range for now.
This moving average delay, combined with the reality that it is not a prediction tool, means over-reliance on one indicator can leave a trader badly misreading conditions during genuinely uncertain, choppy market periods in practice.
How Moving Averages Compare to Other Trend Tools
Understanding how moving averages compare to other trend tools helps clarify what this particular indicator does well, and where other tools capture information a simple average alone simply cannot express on its own for traders.
A moving average vs trendlines comparison shows that traders draw trendlines manually by connecting price swings, while software calculates a moving average automatically from raw data, removing most subjective interpretation from the process entirely today.
Looking at moving average vs Bollinger Bands, the bands add volatility context around a central average, showing whether price currently sits relatively stretched or contained compared to its own recent historical trading range overall today.
A moving average vs RSI comparison highlights a different purpose altogether, since RSI measures momentum and overbought or oversold conditions rather than simply smoothing price into a single, continuous, easy-to-read trend line across most markets.
Recognizing when to combine indicators matters because these complementary technical indicators each answer a different question, and combining them thoughtfully often paints a far fuller picture than relying on any single tool alone in markets.
Frequently Asked Questions
What is a good moving average for beginners to start with?
A 20-day moving average or 50-day MA offers simple settings for new traders, balancing responsiveness and smoothness without overwhelming a beginner who is still learning to read basic beginner moving average chart signals accurately.
Is a 20-day or 50-day moving average better?
Neither is inherently better; the 20-day vs 50-day MA choice depends on timeframe, since the shorter line suits fast-moving trading while the fifty-period line suits a broader, calmer, more patient swing trading approach for now.
What does it mean when the price crosses above the moving average?
Price crossing above MA often signals a possible bullish signal, suggesting buyers are gaining control of the market, though many traders wait for further trend confirmation before treating it as fully decisive for most traders.
Can moving averages predict future prices?
No. As a lagging indicator, a moving average only reflects past prices, which makes the prediction myth misleading; it offers trend confirmation not forecasting, describing history rather than reliably foretelling what comes next in practice.
What is the difference between SMA and EMA in simple terms?
The SMA EMA difference comes down to weighting: SMA treats every price equally, while EMA emphasizes recent prices more heavily, a distinction sometimes summarized simply as weighting explained simply for newer, less experienced traders usually.
What is the 200-day moving average and why is it important?
The 200-day MA significance comes from its role as a long-term benchmark, widely followed for institutional use when gauging whether a broader market currently sits within bullish territory or bearish territory instead in real markets.
How do I add a moving average to my trading chart?
Most platforms include a built-in indicator menu; adding MA to the chart typically involves selecting the moving average type, then adjusting indicator settings through the platform’s own standard charting platform steps and menus during live trading.
Do moving averages work for all assets (stocks, crypto, forex)?
Moving averages across asset classes generally apply broadly, though traders often need a crypto volatility adjustment since faster-moving assets may require noticeably different period lengths for genuinely reliable, meaningful universal applicability across most markets today.