
What Is the RSI Indicator?
The RSI indicator, short for relative strength index, is a widely used momentum oscillator in technical analysis. It measures how fast and how far price has recently moved, giving traders a quick read on market strength.
J. Welles Wilder introduced the RSI definition in his 1978 book, New Concepts in Technical Trading Systems. That publication reshaped how traders evaluate momentum, and the tool has stayed a core part of chart analysis since.
At its core, RSI tracks price momentum by comparing recent gains against recent losses. This captures the speed and magnitude of price changes, turning raw price action into a single number that is easy to read.
The indicator plots on a 0 to 100 scale, moving up when buying pressure dominates and down when selling pressure takes over. This bounded range makes RSI easier to read than raw, unbounded price charts.
As a technical indicator, RSI works across stocks, forex, crypto, and commodities. Traders use it to gauge whether momentum is strengthening or fading, though it works best alongside broader price context rather than alone.
How the RSI Is Calculated
The RSI formula converts price history into a momentum reading using average price movement. It compares the size of recent upward moves against recent downward moves, then converts that comparison into the familiar bounded RSI value.
This process relies on the relative strength formula, written as RS, which divides average gains by average losses over a chosen lookback period. The result feeds directly into the final RSI equation used on most charts.
Two core inputs drive the calculation: average gain and average loss. Both are measured over the same smoothing period, typically expressed in days, and both only count price changes in their respective direction, up or down.
The RS ratio is calculated first, then plugged into the formula RSI = 100 − 100/(1+RS). This equation transforms the raw ratio into a bounded, easy-to-compare figure that traders can quickly scan across different securities.
Most platforms apply Wilder’s smoothing method, a specific averaging technique, when calculating ongoing values. The standard setting is the 14-period RSI, though the underlying formula works identically regardless of which lookback period a trader chooses to apply.
The RSI Formula Explained
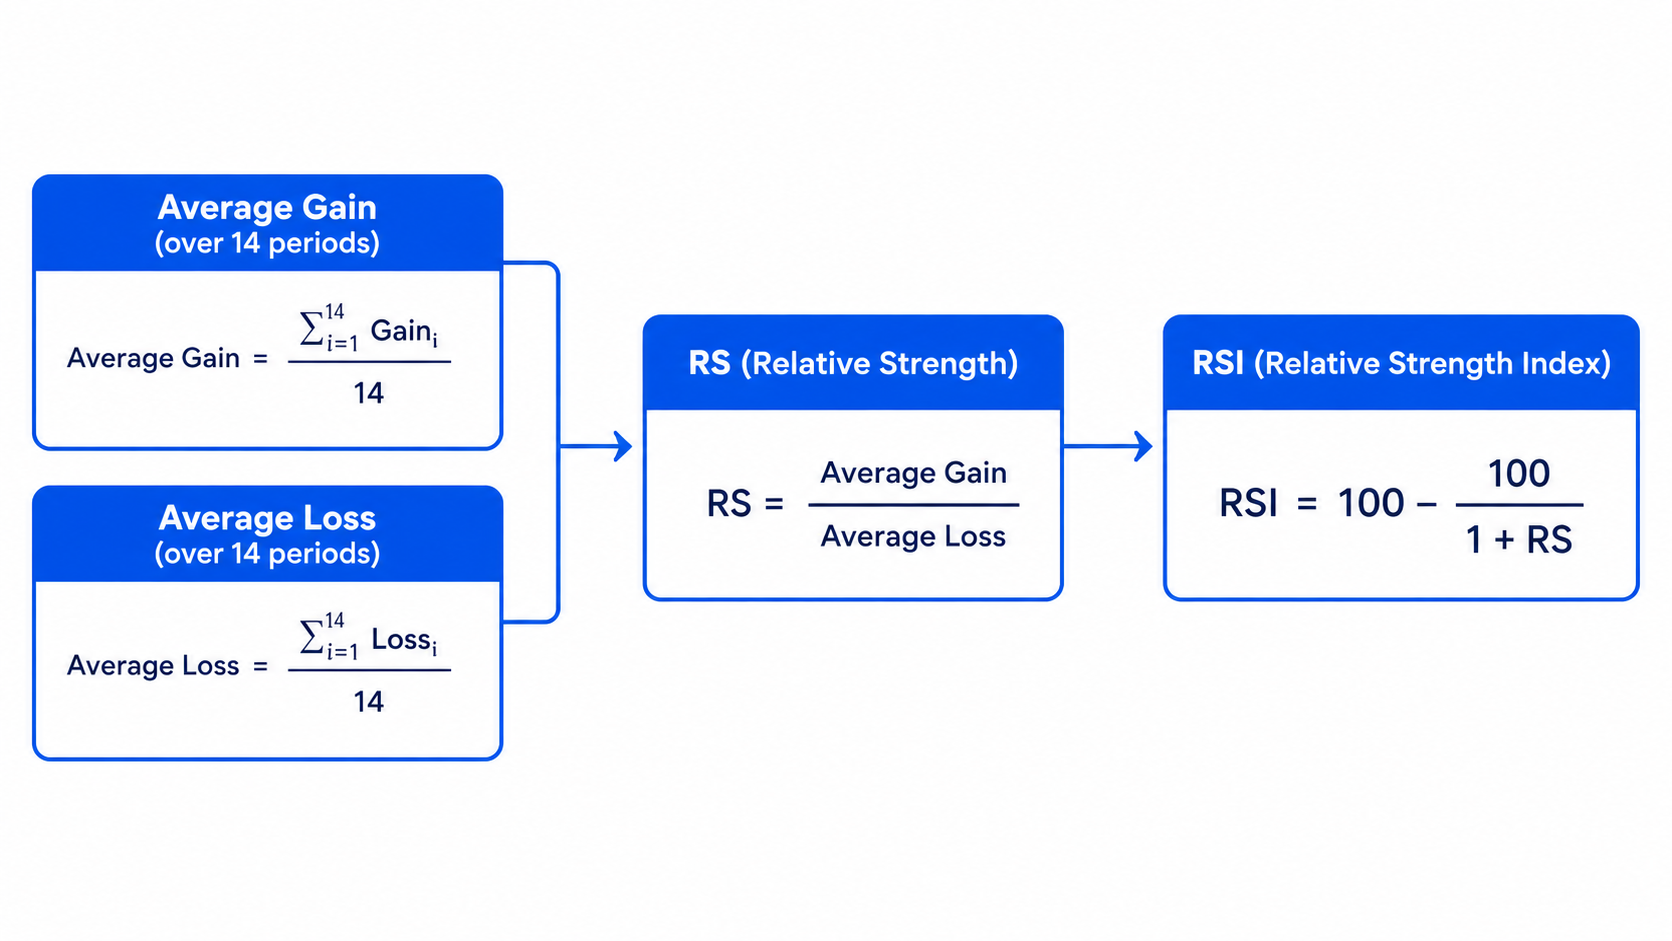
Breaking down the RSI formula breakdown helps clarify what each piece represents. The average gain calculation sums every positive price change over the chosen period, then divides that total by the number of periods used.
The average loss calculation works the same way but focuses only on negative price changes, treating them as positive numbers for the math. Together, these two averages form the basis of the relative strength RS value.
After the first average, most calculations shift to exponential smoothing, weighting recent data more heavily than older data. This distinction between the first average vs subsequent average explains small differences between RSI values on different charting tools.
Step-by-Step Worked Example
Consider a simplified RSI calculation example using sample price data over fourteen trading sessions. Suppose the security closed higher on nine of those days and lower on the remaining five, a mixed pattern.
To build a 14-day average gain example, add every positive close-to-close change, then divide by fourteen. Do the same for losses, treating each decline as a positive value, to produce the average loss figure.
Dividing average gain by average loss gives RS, which flows into the RSI formula for this RSI worked example. This kind of numerical walkthrough shows how calculating RSI by hand connects raw prices to the final reading.
How to Read and Interpret RSI Values
RSI interpretation starts with understanding the RSI scale, which runs from zero to one hundred. Readings near the extremes suggest strong directional pressure, while readings near the middle suggest a more balanced, less decisive market.
Traders commonly watch two key thresholds on this scale: the overbought level and the oversold level. These reference points help frame whether recent momentum has pushed unusually far in one direction relative to its own history.
The most widely used thresholds are RSI 70 and RSI 30. Readings above the higher threshold flag stretched upward momentum, while readings below the lower threshold flag stretched downward momentum, according to Wilder’s original framework.
Between these two thresholds sits the neutral zone, where momentum is neither extreme. Many traders also watch the RSI centerline 50, since crossing above or below it can hint at a broader shift in underlying trend direction.
Rising RSI values generally reflect bullish momentum, while falling values reflect bearish momentum. Reading these shifts alongside price action, rather than in isolation, gives a fuller picture of how conviction is building or fading in the market.
Overbought Conditions (RSI Above 70)
An overbought signal appears when RSI pushes past the seventy mark, historically associated with RSI above 70 readings. This condition suggests that recent gains have been unusually large or unusually fast compared with recent history.
Some traders interpret this as a hint of potential reversal, since momentum sometimes cools after stretching that far. It does not guarantee price will fall, only that upward momentum has reached a historically stretched level.
An overbought reading can reflect exhausted buyers, where fewer participants remain willing to push prices higher. Watching for selling pressure to emerge afterward can help confirm whether momentum is genuinely fading or simply pausing.
Oversold Conditions (RSI Below 30)
An oversold signal occurs when RSI falls under the thirty threshold, marking RSI below 30 territory. This suggests recent losses have been unusually sharp relative to the security’s own recent trading history and pace.
This condition sometimes precedes a potential bounce, as selling momentum becomes stretched and slows down. As with overbought readings, this is a description of momentum, not a guaranteed signal that price will immediately turn higher.
Oversold conditions often reflect exhausted sellers, where downward pressure has less fuel left to continue. Some traders treat this as part of a broader buy signal framework, combined with other confirming evidence before acting.
The 50 Centerline and Trend Confirmation
The RSI 50 line acts as a simple dividing point between stronger and weaker momentum phases. Many traders use it as a rough gauge of trend direction, separate from the overbought and oversold extremes.
When RSI holds above fifty, price is often said to be in bullish territory, reflecting steadier upward momentum. This does not predict future movement, but it does describe the current balance between buying and selling pressure.
Conversely, RSI holding below fifty places momentum in bearish territory, suggesting sellers have more control. Watching how RSI behaves around this centerline offers a form of momentum shift confirmation alongside other technical observations.
RSI Behavior in Strong Trends (Range Shifts)
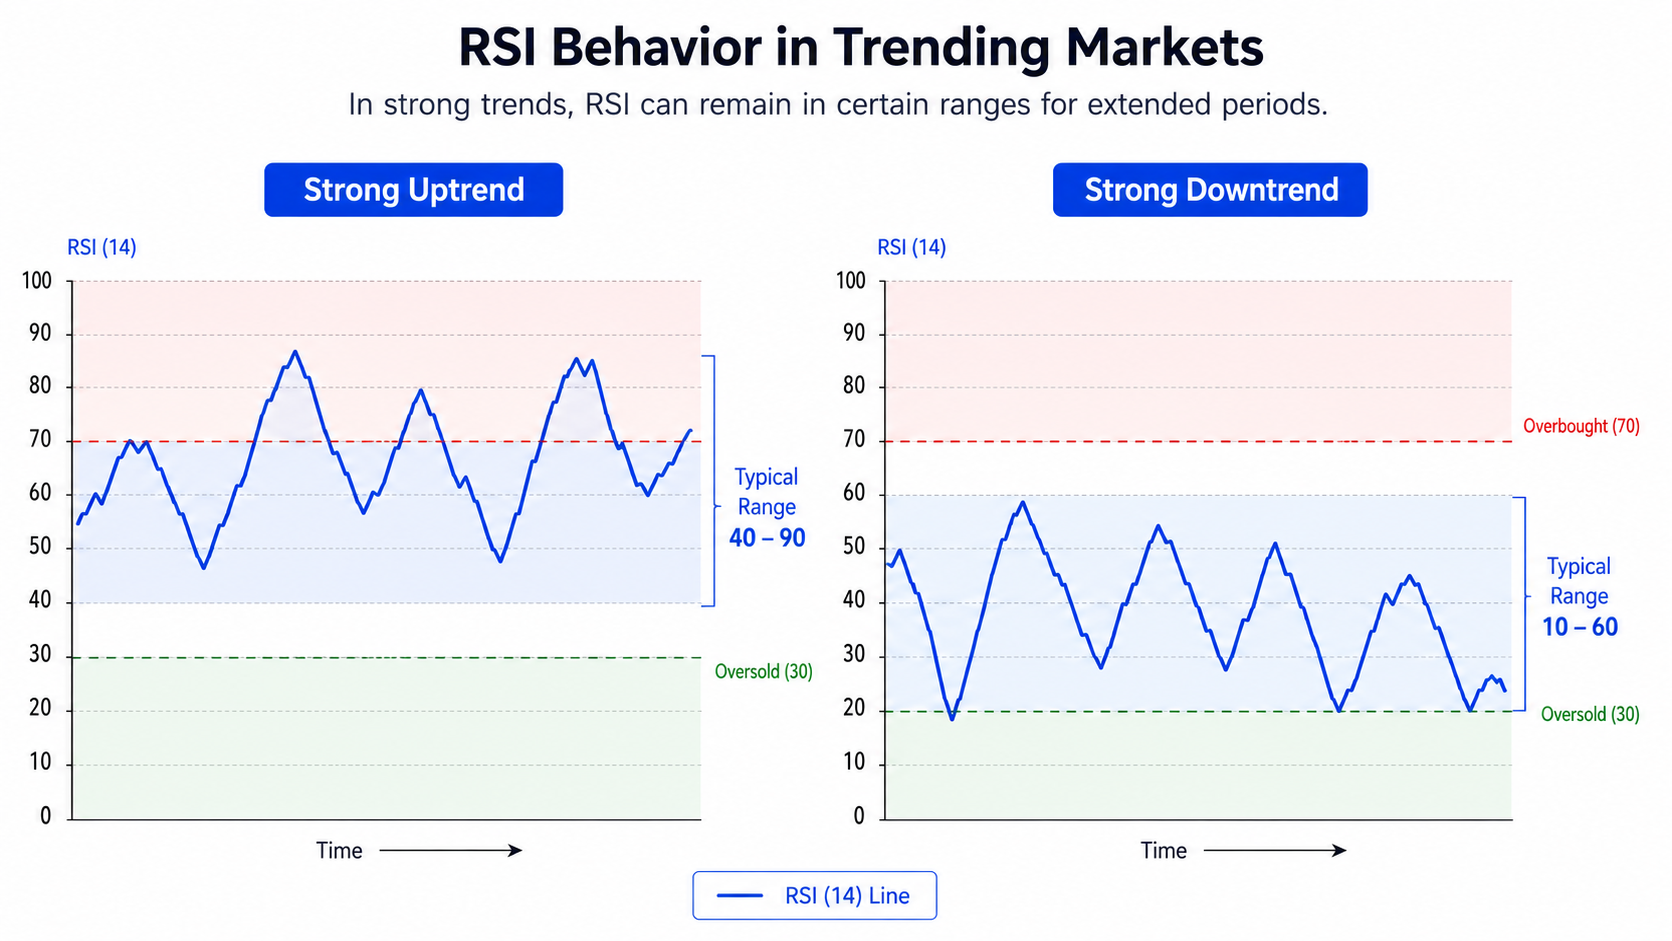
RSI in uptrend conditions often behaves differently than textbook descriptions suggest. Instead of oscillating evenly, RSI can spend extended periods in elevated territory, reflecting persistent and sustained buying pressure throughout the broader trend.
Similarly, RSI in downtrend conditions can keep RSI pinned lower for longer stretches. This RSI range shift means the indicator is not always symmetrical, and its typical resting zone shifts depending on the prevailing trend.
Analysts sometimes describe a 40-90 range bull market, where RSI rarely dips far below forty, and a 10-60 range bear market, where it rarely climbs much above sixty during sustained directional runs in either case.
These shifting support and resistance zones on RSI mean the same reading can carry different meanings depending on context. Recognizing the pattern of staying overbought during strong trends helps avoid misreading persistent momentum as an imminent reversal.
RSI Divergence
RSI divergence describes situations where price and the RSI indicator move in different directions. This disagreement between price and momentum often draws attention because it can signal a change beneath the surface of a trend.
There are two primary forms: bullish divergence and bearish divergence. Each describes a different kind of mismatch between where price is heading and where underlying momentum, as measured by RSI, actually appears to be heading.
At the core of divergence analysis is this price and momentum disagreement. When price makes a new extreme but RSI does not confirm it, that gap is often treated as worth watching closely by technical traders.
Beyond the standard pattern, some traders also study hidden divergence, which behaves differently from regular divergence. Both variations are read as different flavors of a possible trend reversal signal, though their implications are not identical.
A related concept is the failure swing, where RSI fails to reach a new extreme even as price continues moving. This pattern is often discussed alongside divergence because both hint at weakening underlying momentum.
Bullish Divergence
Bullish RSI divergence appears when price makes lower low readings while the oscillator does not follow suit. This mismatch is often read as an early hint that downward pressure may be losing some of its force.
Specifically, this pattern is confirmed when RSI makes higher low readings even as price itself continues falling to new lows. That contrast between weakening RSI lows and falling price lows forms the core signal.
This setup is generally associated with weakening selling pressure beneath the surface of a decline. Traders sometimes watch for a reversal to the upside afterward, though confirmation from price action is typically still required.
Bearish Divergence
Bearish RSI divergence forms when price makes higher high levels while RSI fails to keep pace with that advance. This gap between rising price and stalling momentum draws attention from traders watching for exhaustion.
The defining feature is when RSI makes lower high readings even as price pushes to a fresh peak. That divergence between a strong price high and a weaker RSI high is the essential pattern here.
This configuration often points to weakening buying pressure even while price continues climbing on the surface. Some traders watch for a possible reversal to the downside, again treating it as one input among several.
How to Spot Divergence on a Chart
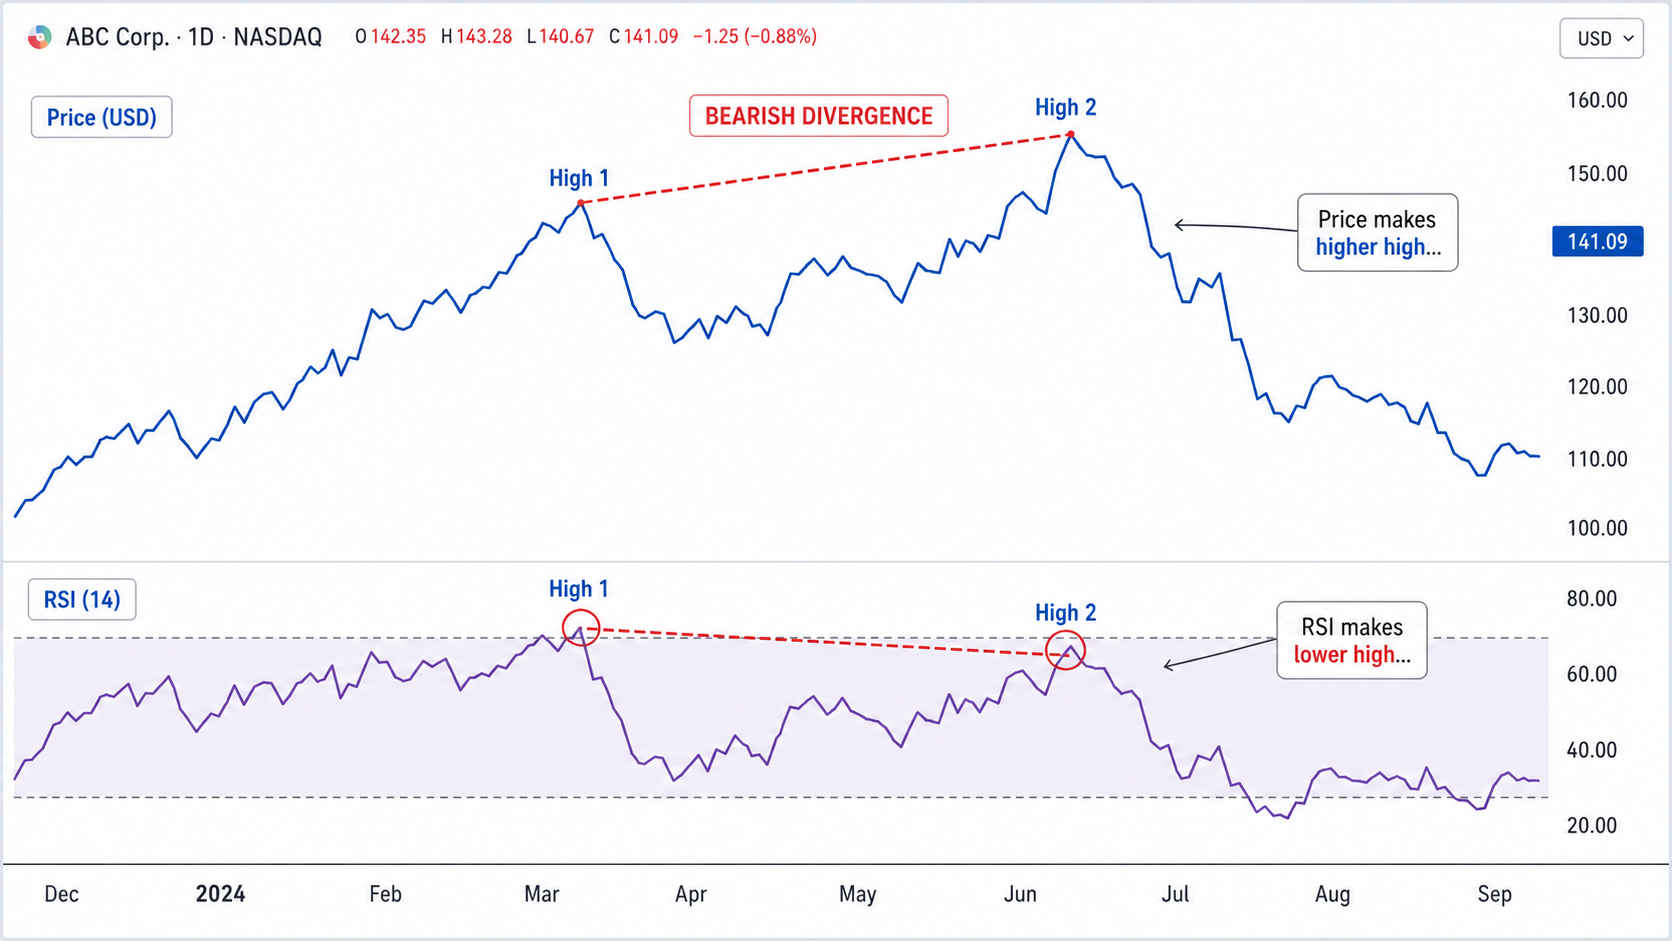
Identifying divergence starts with locating clear swing highs or swing lows on both the price chart and the RSI panel beneath it. Divergence only becomes meaningful when comparing matching structural points between the two.
This process involves comparing swing highs and lows across at least two recent turning points. A single mismatched point is not enough; consistent contrast across multiple points strengthens the case for genuine divergence.
Beyond visual spotting, traders often look for chart pattern confirmation, such as a broken trendline, before acting. The relevant divergence timeframe also matters, since patterns on longer charts tend to carry more analytical weight.
Limitations of Divergence Signals
False divergence occurs more often than many traders expect, particularly during choppy or directionless markets. Not every mismatch between price and RSI leads to the reversal that divergence analysis might otherwise seem to suggest.
Divergence in strong trends can persist for long stretches without any meaningful reversal occurring. A trending market can show repeated divergence signals while price simply continues its established path in the same direction.
For this reason, many practitioners treat divergence as a guiding principle. Combining divergence with confirmation, such as price structure or volume, is a common way analysts approach this known limitation.
Best RSI Settings and How to Adjust the Period
RSI period settings determine how sensitive the indicator is to recent price swings. Shorter periods react quickly to small moves, while longer periods smooth out noise and respond more slowly to sudden price changes.
The 14-period default, chosen by Wilder himself, remains the most widely used setting across charting platforms. It offers a balance between responsiveness and stability that many traders find suitable for general-purpose technical analysis.
A 9-period RSI reacts faster and suits short-term trading settings, since it highlights smaller, more frequent momentum shifts. This added sensitivity can also mean more frequent signals, including some that may prove less reliable.
On the other end, a 21-period RSI smooths readings further, often favored under swing trading settings where traders focus on longer price swings and prefer fewer, steadier signals over rapid, frequent daily fluctuations.
This choice reflects a broader sensitivity tradeoff between responsiveness and reliability. Some traders also experiment with adjusting overbought/oversold thresholds, such as shifting to 80/20 levels, to better match a specific security’s typical behavior.
How to Use RSI in a Trading Strategy
An RSI trading strategy typically combines the oscillator with clear rules for entry and exit signals. Because RSI alone only measures momentum, most structured approaches pair it with additional context before making any decision.
One common approach involves combining RSI with trend analysis, using the broader price direction to filter which RSI signals get attention. This helps avoid acting on momentum readings that run counter to the dominant trend.
Some traders build a RSI crossover strategy, watching for the indicator to cross specific levels rather than simply touching them. Others study the RSI failure swing pattern as an alternative confirmation tool within their process.
Another approach involves using RSI with support and resistance, watching how momentum behaves as price approaches known chart levels. This combination can add context that RSI alone, viewed in isolation, would not provide.
Every version of an RSI-based strategy is built around structure and rules rather than reacting to single readings. Consistent, well-defined criteria tend to matter more than the specific indicator settings chosen for the approach.
RSI Reversal Strategy
A reversal-based approach centers on buying oversold conditions and selling overbought conditions as momentum reaches historical extremes. This is one of the more straightforward ways traders have traditionally approached the RSI indicator overall.
This kind of reversal trade setup relies on the idea that stretched momentum eventually slows or reverses. However, extremes can persist longer than expected, which is why timing remains a genuine challenge with this method.
Because of that risk, many traders look for additional entry confirmation before acting on an extreme RSI reading alone. This might include candlestick patterns, support levels, or other indicators aligning with the RSI signal.
RSI Trend-Following Strategy
Rather than fading extremes, this approach uses RSI to confirm trend strength as it unfolds. Using RSI to confirm trend strength means watching whether momentum stays consistently on one side of the neutral zone.
A common technique is a centerline crossover strategy, where crossing above or below fifty is treated as a signal worth noting. This shifts the focus from extremes toward the broader direction of momentum instead.
This method emphasizes trading with the trend rather than anticipating a reversal. It tends to generate fewer signals than reversal-based approaches, since it waits for sustained momentum rather than reacting to short-term extremes.
Combining RSI With Other Indicators
Many traders pair RSI and MACD together, since each measures momentum from a slightly different angle. This layered view can highlight agreement or disagreement between two separate but related momentum calculations over time.
Others combine RSI and moving averages to add trend context to momentum readings. Watching RSI and volume together can also reveal whether a momentum reading is backed by meaningful participation or thin trading activity.
This general approach, often called multi-indicator confirmation, aims at reducing false signals that any single tool might produce on its own. No combination eliminates uncertainty, but layering perspectives can add useful context here.
Common RSI Mistakes and Limitations
One frequent issue involves RSI false signals, which occur when the indicator suggests a shift that never develops. Momentum tools are not predictive in a guaranteed sense, and false readings are a normal part of use.
A related mistake is relying on RSI alone without considering price structure, volume, or the broader market environment. Treating any single indicator as a complete trading system tends to overlook important surrounding context.
RSI in strong trends can behave in ways that surprise newer traders, staying stretched for extended periods. This behavior is not a flaw in the calculation; it simply reflects how momentum works during sustained directional moves.
As a lagging indicator in some respects, RSI reflects recent price history rather than predicting future price movement outright. This lag can contribute to whipsaw signals, where the indicator flips direction repeatedly during choppy conditions.
Finally, overtrading on RSI and ignoring the broader trend are common pitfalls among newer traders. Reacting to every minor fluctuation, rather than stepping back for context, often leads to inconsistent and frustrating results.
RSI vs. Other Momentum Indicators
Comparing RSI vs MACD highlights a key difference in what each tool measures. RSI focuses on the speed and scale of recent price changes, while MACD tracks the relationship between two moving averages over time.
Looking at RSI vs Stochastic Oscillator reveals another contrast in calculation method. The Stochastic Oscillator compares closing price to a recent trading range, while RSI compares the magnitude of recent gains against recent losses.
A more specialized comparison is RSI vs Stochastic RSI, since the latter applies stochastic calculations directly to RSI values themselves. This creates a more sensitive, faster-reacting derivative built from the original RSI formula.
These differences between momentum indicators matter because each tool emphasizes a slightly different aspect of price behavior. No single indicator captures every dimension of momentum, which is why traders often study several together.
Understanding when to use which indicator depends on trading style, timeframe, and personal preference for signal frequency. There is no universally correct choice, only tools suited differently to different analytical approaches and goals.
How to Set Up RSI on a Trading Platform
Adding RSI to a chart typically starts within a platform’s indicator or studies menu, where users search for the oscillator by name. Most modern charting platforms include RSI as a built-in, ready-to-use technical tool.
For a practical example, the TradingView RSI setup involves opening the indicators panel, searching for RSI, and applying it directly beneath the main price chart. The oscillator then appears in its own separate panel below.
Traders can handle adjusting RSI periods on a platform by opening the indicator’s settings dialog after it has been applied. From there, the lookback period can be changed from the default to any preferred number.
Within that same dialog, the RSI indicator settings menu usually allows adjustment of overbought and oversold threshold lines as well. Colors, line thickness, and other display preferences are often customizable in this same location.
This process for applying RSI to any chart remains broadly similar across most major platforms, even though menu names and layouts differ slightly. Once configured, the settings typically remain saved for future chart sessions.
Frequently Asked Questions
What is a good RSI value to buy?
There is no universal RSI buy signal value, though some traders watch for an oversold entry near the thirty level. Most practitioners pair this reading with additional confirmation before buying rather than acting on RSI in isolation.
What does RSI 14 mean?
RSI 14 refers to the RSI 14 period, the default setting established by Wilder. It defines the lookback period used in the calculation, meaning the indicator averages gains and losses over the past fourteen sessions.
Is RSI a leading or lagging indicator?
RSI is generally considered a lagging indicator, since it is built from past price data rather than forecasting the future. Some traders describe it as having a leading indicator feel near extremes, though its core predictive limitations remain.
Can RSI be used for day trading?
Yes, RSI can be applied using intraday RSI data on shorter charts. However, day trading settings often require careful attention to short timeframe noise, since rapid price swings can generate frequent, less reliable readings.
What is the difference between RSI and Stochastic RSI?
Stochastic RSI applies stochastic math to standard RSI values, creating a sensitivity difference between the two. As a derivative indicator, Stochastic RSI reacts faster and produces more frequent signals than the original RSI calculation.
Does RSI work in crypto and forex markets, not just stocks?
Yes, RSI crypto and RSI forex applications are common, since the formula only requires price data. This cross-market applicability makes RSI a flexible tool across nearly any actively traded financial instrument or asset.
Why does RSI stay overbought for a long time during a strong trend?
Extended overbought readings reflect genuine strong trend behavior, where buying pressure remains consistently dominant. Treating this persistence as an automatic false sell signal is a common misreading of how momentum behaves in sustained trends.
What is a good RSI strategy for beginners?
A simple beginner RSI strategy often starts with observing overbought and oversold zones using simple entry rules alongside price confirmation. This offers a manageable starting point for new traders before exploring more advanced combinations.