
What Is the MACD Indicator?
The MACD indicator stands for Moving Average Convergence Divergence. It is a momentum indicator used in technical analysis. It measures the relationship between two moving averages of price, helping traders read shifts in market sentiment.
Gerald Appel developed the MACD indicator in the late 1970s. It became one of the most trusted tools in technical analysis. Its design combines trend detection and momentum measurement in a single view of direction and strength.
As a trend-following indicator, MACD reacts to changes in an exponential moving average. It does not react to raw price alone. This smoothing makes it a lagging indicator, confirming moves already underway instead of predicting them.
Unlike a pure price oscillator, MACD can move above or below a central point without strict bounds. This flexibility lets it reflect both trend strength and price momentum across many market conditions.
Traders use the MACD indicator to confirm trend direction and spot early momentum shifts. It also helps with timing entries or exits. Blending multiple exponential moving average values gives a smoother signal than raw price swings.
MACD Formula and Components
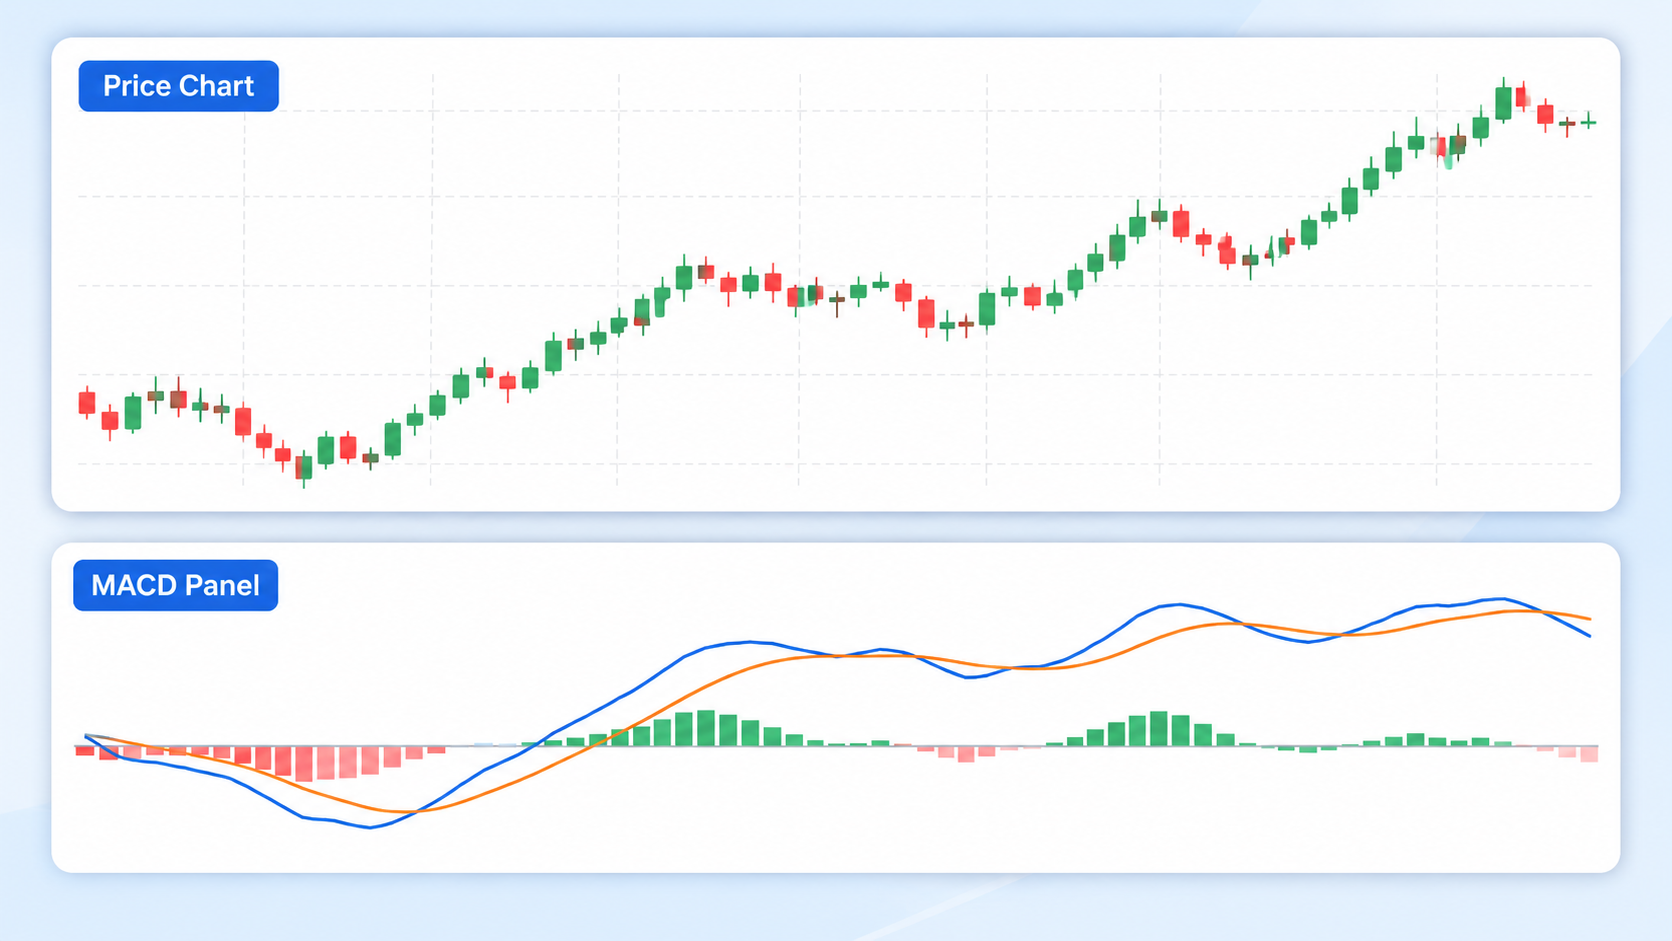
The MACD formula rests on three core building blocks. These are the MACD line, the signal line, and the MACD histogram. Together, these components turn raw price data into a readable picture of momentum.
Each element depends on exponential moving average calculation. This method weights recent prices more heavily than older ones. That weighting lets MACD react faster to fresh price action than a simple moving average would allow.
The 12-period EMA and 26-period EMA form the foundation of the MACD line. A 9-period EMA of that line becomes the signal line, used for comparison and crossover signals.
A zero line anchors the entire structure. It marks the point where the fast and slow exponential moving averages are equal. Readings above or below this line carry distinct meaning for traders.
Understanding how these pieces interact matters before applying MACD to any chart. The following subsections break down each component individually. We start with the MACD line and build toward the complete indicator.
The MACD Line
The MACD line formula subtracts the 26-day EMA from the 12-day EMA. This simple act of subtracting moving averages produces a single line. It oscillates around zero as momentum builds or fades.
The 12-day EMA reacts faster to price than the 26-day EMA. Because of this, it is often called the fast EMA. The 26-period average is known as the slow EMA in this relationship.
When the fast EMA rises above the slow EMA, the MACD line turns positive, signaling upward momentum. When it falls below, the line turns negative, reflecting downward price pressure.
The Signal Line
The signal line comes from applying a 9-period EMA of MACD values. It acts as a smoothed reference line. This helps traders separate genuine momentum shifts from short-term price noise.
Because it is derived from smoothing the MACD line, the signal line moves more slowly. This lag is intentional. Comparing a faster line to a slower one creates usable crossover points for traders.
Many traders call this smoothed output the trigger line. Crossovers between it and the MACD line often trigger buy or sell considerations within a broader trading plan.
The MACD Histogram
The MACD histogram is a bar chart plotted below the main indicator lines. It visually represents the distance between MACD and signal line. That gap expands or shrinks as momentum changes.
When the MACD line moves away from the signal line, the histogram bars grow taller. This pattern is known as convergence and divergence, depending on whether the lines separate or come together.
This momentum visualization gives traders a quick way to judge strength. It works without reading the raw line values. Larger bars suggest stronger momentum, while shrinking bars often hint at a slowing trend.
The Zero Line (Centerline)
The zero line, or centerline, marks the equilibrium point. This is where the 12-period EMA and 26-period EMA are exactly equal. It serves as the dividing line between bullish and bearish territory.
This point also represents the EMA crossover point, where the fast and slow averages intersect. Crossing above it signals rising momentum. Crossing below it suggests weakening or negative price pressure.
Traders often describe positions above this line as the bullish zero line region. Positions below it fall into the bearish zero line region. This framing helps traders judge the broader trend quickly.
How to Calculate MACD (Step-by-Step With a Worked Example)
Learning how to calculate MACD by hand builds a deeper understanding of the indicator. Most platforms compute it automatically. Still, walking through the MACD calculation steps manually reveals the underlying logic.
The process relies entirely on historical price data, typically closing prices. These feed into an EMA calculation formula. Each step builds on the previous one, moving from raw prices to a finished indicator.
A key concept throughout this process is the smoothing constant. It determines how much weight recent prices receive relative to older ones. This applies within every exponential moving average used in the calculation.
Performing a manual MACD calculation at least once helps traders trust the indicator. It stops the tool from feeling like a black box. It also clarifies why MACD reacts as it does to sudden price changes.
The next five subsections walk through a complete MACD worked example. We start with the fast average and move through the slow average. We finish with the histogram derived from both smoothed lines.
Step 1: Calculate the 12-Period EMA
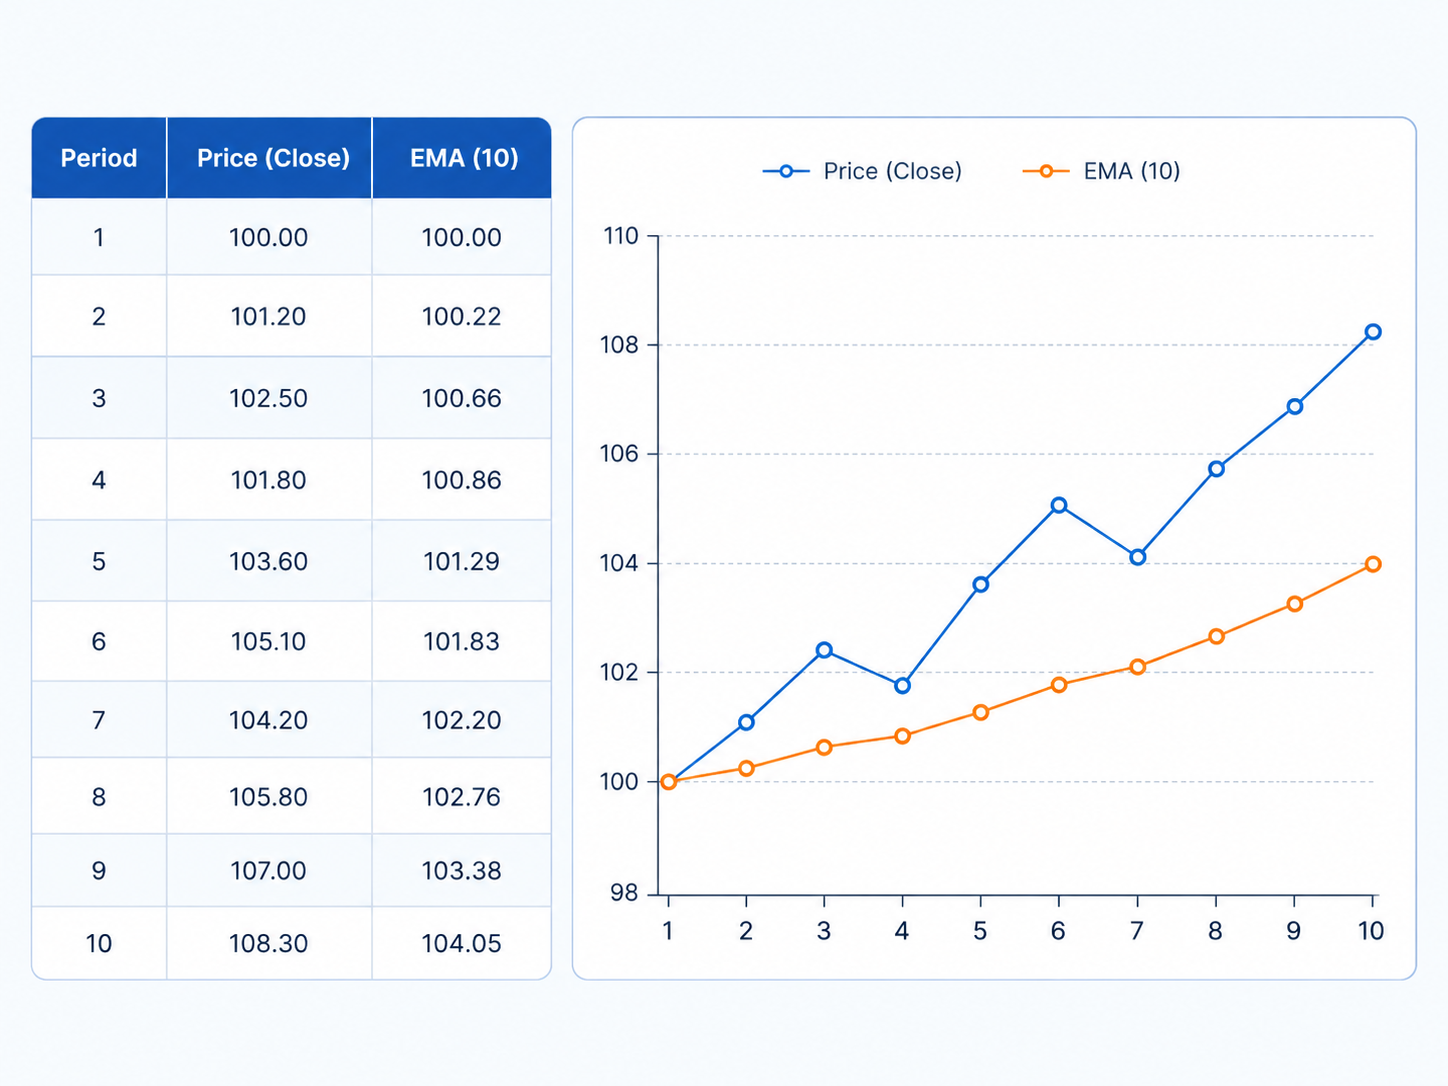
The 12-period EMA formula starts with a simple average of the first twelve closing prices. This initial value becomes the seed for all later fast exponential moving average calculations.
Next, apply the smoothing multiplier. For a twelve-period average, it equals two divided by thirteen. This multiplier determines how strongly each new closing price influences the updated exponential moving average value.
Each new EMA value equals the current price minus the previous EMA, multiplied by the multiplier, then added back to the previous EMA. Repeating this produces a continuously updated fast average line.
Step 2: Calculate the 26-Period EMA
The 26-period EMA formula mirrors the twelve-period process. It uses twenty-six closing prices for its initial simple average. This becomes the starting point for the slow exponential moving average calculation.
Its smoothing multiplier equals two divided by twenty-seven. That is a smaller value than the twelve-period version. This smaller multiplier makes the slow average respond more gradually to recent price changes.
Because it reacts more slowly, the 26-period EMA filters out short-term noise more effectively. This creates a smoother baseline. The faster twelve-period average can then be meaningfully compared against it.
Step 3: Subtract the EMAs to Get the MACD Line
With both averages calculated, the MACD line calculation becomes straightforward. Subtract the 26-period EMA value from the 12-period EMA value at each point to produce the raw MACD reading.
This EMA difference captures the gap between short-term and long-term price momentum. A widening positive gap suggests strengthening upward momentum. A widening negative gap points toward accelerating downward pressure.
The process of subtracting 26 EMA from 12 EMA repeats for every new price bar. It produces a continuous line that traders plot directly on their charts alongside price action.
Step 4: Calculate the 9-Period Signal Line
The signal line calculation applies the same EMA logic used earlier. This time, it applies to the MACD line values themselves, not to raw closing prices from the underlying asset.
This process, known as smoothing the MACD line, uses a smoothing multiplier of two divided by ten. That multiplier reflects the nine periods of data drawn from the MACD output.
The result is a 9-day EMA of MACD values, plotted alongside the original line. Comparing these two lines forms the basis for the crossover signals discussed later in this guide.
Step 5: Calculate the Histogram
Histogram calculation is the simplest remaining step. Subtract the signal line value from the MACD line value at each point. This produces the MACD minus signal line difference plotted as bars.
These bars can show positive and negative histogram values, depending on which line sits higher. Positive bars appear when the MACD line trades above the signal line. Negative bars appear when it trades below.
Watching how these bars change size over time offers a quick visual cue for momentum. This complements the raw crossover signals produced by the two underlying lines themselves.
Full Worked Numerical Example
Consider a MACD calculation example using sample stock price data over several weeks. After computing the twelve and twenty-six period EMAs, subtracting them produces the raw MACD line for each trading day.
Suppose the example MACD output shows a MACD line value of 1.20 and a signal line value of 0.95 on a given day. The histogram would then read 0.25, reflecting mild bullish momentum.
Working through this step-by-step numbers process shows how three related lines emerge. Even with simplified figures, closing prices and a handful of smoothing formulas produce the full indicator.
How to Read and Interpret the MACD Indicator
Reading MACD effectively means looking beyond a single line. It requires considering how all three components interact together. Interpreting MACD signals takes context from the broader chart, not just the indicator alone.
The MACD line position relative to the signal line and the zero line offers the first layer of interpretation. It gives traders an immediate sense of momentum direction without deeper calculation.
Beyond position, the histogram adds a second layer by showing whether momentum is accelerating or fading. This combination supports trend confirmation and helps traders avoid acting on a single misleading signal.
Both bullish momentum and bearish momentum phases produce recognizable MACD patterns. These patterns work best when read alongside price structure, support and resistance levels, and overall market context.
The next three subsections break interpretation into three practical lenses. These are line position, histogram behavior, and placement relative to the zero line. Each offers a distinct piece of the momentum picture.
MACD Line vs. Signal Line Position
When the MACD line trades above the signal line, it typically reflects strengthening upward momentum. This relationship forms the basis of the most commonly referenced momentum shift signal in MACD analysis.
The MACD line can also sit below the signal line. When it does, downward momentum tends to dominate. Traders often treat this positioning as a caution flag, particularly after prior upward movement.
The distance between these two lines also matters. A small gap suggests indecision. A widening gap between the MACD line and signal line reflects a more decisive momentum shift.
Histogram Size and Momentum Strength
An expanding histogram indicates that the gap between the MACD line and signal line is growing wider. This typically points to momentum acceleration, whether the broader move is bullish or bearish.
A contracting histogram shows the two lines moving closer together instead. This often signals momentum deceleration. It sometimes precedes a crossover or a pause in the current directional move.
Watching histogram size over several sessions gives a clearer read than a single bar. It shows whether momentum is genuinely building or just fluctuating within a stable trading range.
Position Relative to the Zero Line
When the MACD line sits above zero, it confirms that the 12-period EMA remains higher than the 26-period EMA. This places the market in broadly positive territory for the selected timeframe.
When the line falls below zero, the fast average sits beneath the slow average. This places conditions in negative territory, often aligning with a broader downtrend across the analyzed price history.
Combining zero line position with line and histogram behavior gives a fuller picture. A bullish crossover above zero generally carries more weight than one occurring deep in negative territory.
MACD Trading Signals
MACD trading signals fall into several recognizable categories. Each offers different information about potential entry and exit points within a broader trading approach. No single signal type works in every situation.
The most familiar category involves crossover signals, where the MACD line and signal line intersect. These moments often generate the clearest buy signal or sell signal interpretations among all MACD patterns.
Beyond crossovers, divergence signals compare price action directly against the indicator itself. This flags situations where the two disagree, often preceding a meaningful shift in market direction.
Because MACD combines trend and momentum information, its signals tend to work best in trending markets. They perform less reliably in tight, directionless consolidation ranges over extended periods.
The following four subsections examine each signal type individually. We start with the basic crossover and progress toward more advanced divergence-based readings used by experienced technical traders.
Signal Line Crossover (Bullish and Bearish)
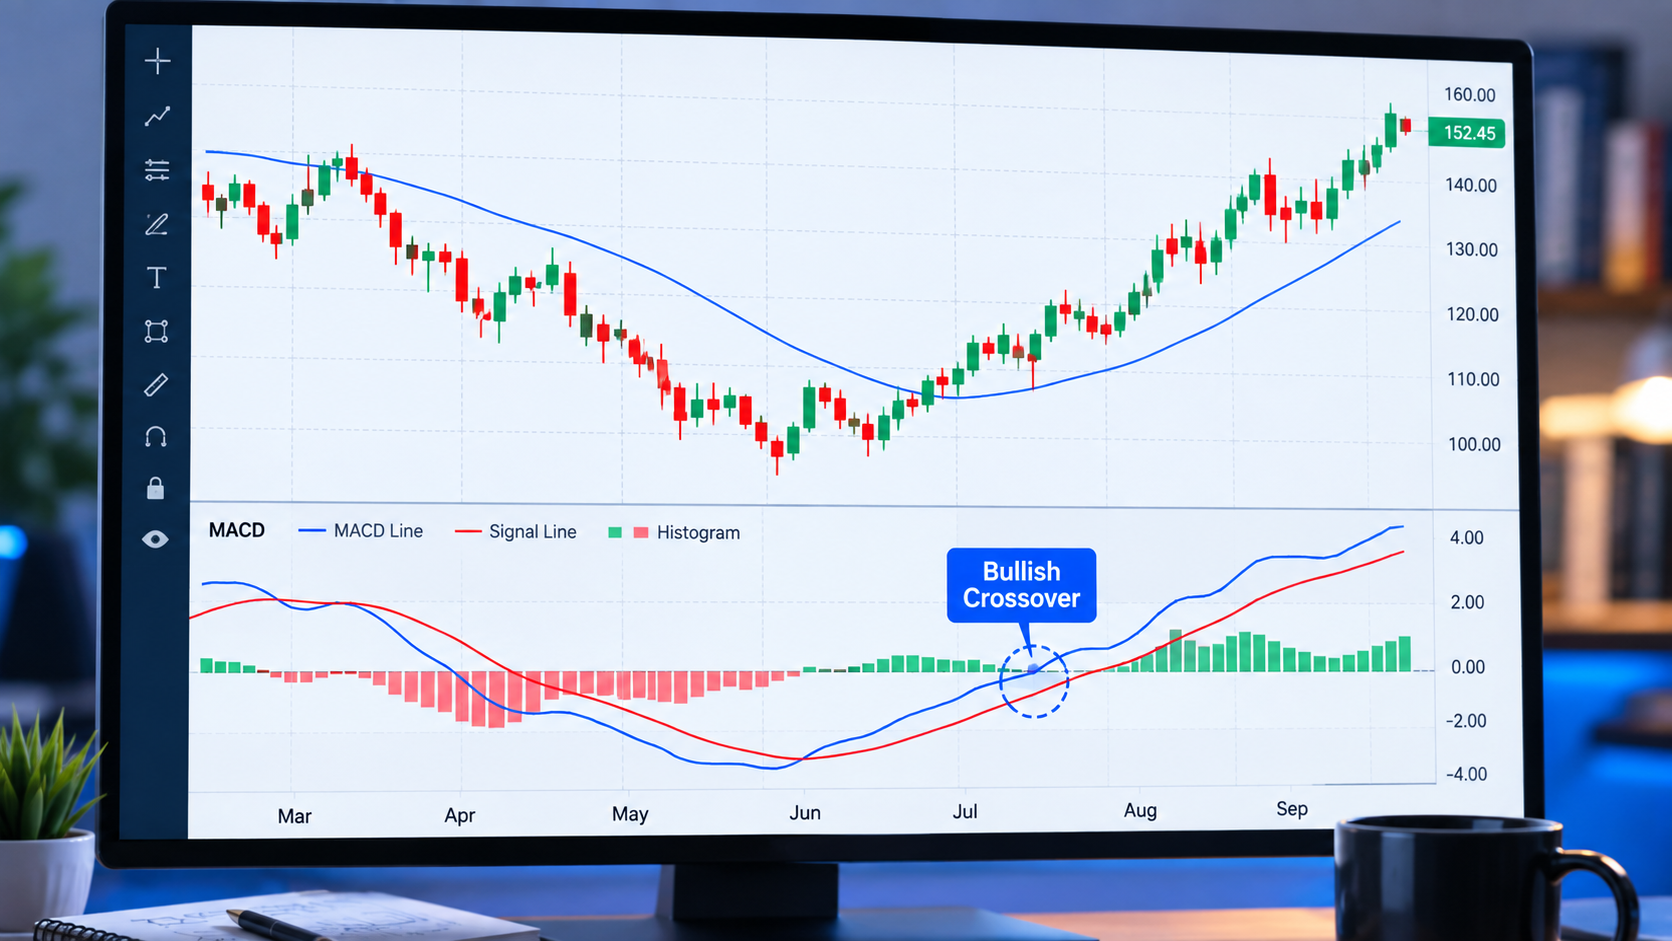
A bullish crossover occurs when the MACD line crosses above the signal line. It is often interpreted as an early buy signal, suggesting that upward momentum may be building.
A bearish crossover happens when the MACD line crosses below the signal line. This is frequently read as a sell signal, suggesting fading momentum or a shift toward downward price pressure.
This basic MACD crossover is sometimes called a trigger line cross. It forms the foundation for many simple trading rules, though additional context strengthens its reliability considerably.
Zero Line Crossover
A zero line cross occurs when the MACD line moves from negative to positive territory, or the reverse. This event often provides trend change confirmation at a broader structural level than crossovers alone.
Moving from below zero to above it reflects a shift from bearish to bullish territory. This suggests the fast average has overtaken the slow average across the full measurement window used.
Zero line crossovers happen less frequently than signal line crossovers. Because of this, many traders treat them as stronger, if slower, confirmation of a genuine trend change.
MACD Divergence (Bullish and Bearish)
Bullish divergence appears when price makes a lower low while the MACD indicator makes a higher low. This price vs indicator disagreement can act as an early trend reversal warning.
Bearish divergence works in the opposite direction. It occurs when price reaches a higher high while MACD forms a lower high, often reflecting momentum divergence ahead of a potential downward shift.
Divergence signals require patience. Price can continue moving in its original direction for some time, even after momentum has clearly weakened according to the underlying indicator readings.
Hidden Divergence (Trend Continuation Signal)
Hidden bullish divergence occurs when price forms a higher low while MACD forms a lower low. This suggests the existing uptrend may resume after a temporary pullback confirmation phase.
By contrast, MACD forming a higher high while price makes a lower high signals hidden bearish divergence. It often points to trend continuation to the downside rather than a genuine reversal.
Regular divergence opposes the existing trend, but hidden divergence favors it instead. This makes hidden divergence useful for timing entries during pullbacks within an established move.
Best MACD Settings
Choosing the right MACD settings depends heavily on trading style, timeframe, and the specific asset being analyzed. No single configuration outperforms every other setting in all conditions.
The default MACD settings of twelve, twenty-six, and nine have remained standard since Gerald Appel first introduced the indicator. They balance responsiveness against reliability across a wide range of markets.
Customizing MACD parameters involves adjusting the fast and slow EMA periods, along with the signal line period. These adjustments better match shorter or longer holding periods favored by different trading approaches.
Faster settings increase sensitivity but also increase the number of false signals during choppy conditions. Slower settings reduce noise but may delay entries and exits beyond an ideal timing window.
The following four subsections explore standard settings, day trading adjustments, swing and long-term configurations, and how MACD behavior shifts across different chart timeframes.
Standard Settings (12, 26, 9)
The default MACD parameters of twelve, twenty-six, and nine were designed with daily chart settings in mind. They reflect roughly two, four, and nine-tenths of a trading week.
These standard settings remain the most widely used configuration across trading platforms today. They offer a reasonable balance between responsiveness and reliability for general-purpose technical analysis work.
Most traders begin with these defaults before experimenting with faster or slower variations. Deviating too early can make it harder to judge whether results stem from settings or strategy.
Best MACD Settings for Day Trading
Day trading MACD settings often shift toward a faster MACD configuration, such as five, thirteen, and one. This helps capture quicker momentum shifts within a single trading session.
On a 5-minute chart MACD setup, faster periods increase intraday sensitivity. The indicator reacts more quickly to rapid price swings that define shorter holding periods common in day trading.
However, this increased sensitivity also raises the risk of false signals. Faster settings react to short bursts of volatility that may not reflect a genuine change in direction.
Best MACD Settings for Swing Trading and Long-Term Investing
Swing trading MACD setups often favor slightly slower configurations. Some traders extend toward a longer period EMA combination to filter out short-term noise while capturing multi-day directional moves.
For longer horizons, a weekly chart MACD setup smooths out daily fluctuations entirely. It focuses instead on broader trend shifts that unfold over weeks or months.
This slower approach supports reducing false signals, since fewer crossovers occur overall. It also means signals arrive later relative to the actual turning point in price.
How MACD Behaves Differently Across Timeframes
MACD timeframe sensitivity varies significantly depending on the chart being analyzed. Shorter timeframes produce more frequent, smaller signals. Longer timeframes produce fewer, more significant directional readings overall.
Comparing a higher timeframe vs lower timeframe view of the same asset often reveals conflicting signals. Short-term momentum can move against the prevailing direction shown on longer-term charts.
This difference highlights the value of noise reduction achieved on higher timeframes. Random short-term fluctuations matter less there, and genuine directional shifts stand out more clearly.
How to Use MACD in a Trading Strategy
Building a complete MACD trading strategy requires more than reacting to individual crossovers. It involves combining multiple signals, timeframes, and confirming tools into a consistent analytical framework over time.
Combining indicators with MACD helps filter out weaker signals. Relying on a single tool increases exposure to false readings that occur naturally within any momentum-based analytical approach.
Confirmation signals from price structure, volume, or other indicators add another layer of validation. They reduce the likelihood of acting on a crossover that later reverses without meaningful follow-through.
Clear entry and exit rules matter as much as the signals themselves. Even accurate readings provide little value without a consistent framework for acting on them and managing risk.
The following four subsections outline practical ways to structure a MACD-based approach. They move from a simple standalone method to more advanced multi-indicator and multi-timeframe combinations.
MACD Crossover Strategy
A basic MACD crossover strategy treats bullish crossovers as potential entry points. Bearish crossovers become potential exit points, forming the simplest possible framework built around this single indicator.
Clear entry rules typically require the MACD line to cross above the signal line. Ideally, this happens near or above the zero line, reducing the chance of trading against the dominant trend.
Corresponding exit rules often trigger when the opposite crossover occurs. Some traders also incorporate stop-loss levels to manage risk independently of the indicator’s own signals.
MACD + RSI Strategy
The MACD and RSI combination pairs a trend-based momentum tool with a bounded oscillator. This allows traders to seek momentum confirmation from two independent perspectives before acting on a signal.
RSI’s overbought oversold filter helps avoid entering trades late in an already extended move. It complements MACD’s tendency to lag behind sudden, sharp price reversals in fast-moving markets.
When both indicators align, such as a bullish MACD crossover alongside RSI moving out of oversold territory, the combined signal often carries more weight than either indicator alone.
MACD + Moving Average or Trendline Strategy
Applying a MACD with trend filter approach means only acting on crossover signals that align with a longer-term moving average or an established trendline on the chart.
Moving average confirmation helps ensure trades follow the dominant trend rather than fighting against it. It reduces exposure to false signals during brief countertrend momentum shifts.
A trendline breakout combined with MACD can also strengthen a signal. A genuine breakout accompanied by rising momentum suggests broader participation behind the emerging price move.
Multiple Timeframe MACD Analysis
Multi-timeframe analysis involves checking MACD on a longer chart first. This establishes the higher timeframe trend before looking at a shorter chart for precise entry timing.
This approach uses the lower timeframe entry timing to fine-tune trade placement. The higher timeframe view acts as a filter that discourages trading against the dominant underlying trend.
Combining timeframes this way reduces the number of conflicting signals a trader encounters. Only setups aligned across both perspectives typically qualify for consideration under this method.
How to Set Up MACD on Trading Platforms
Adding MACD indicator tools to a chart is usually a straightforward process. The exact steps differ slightly depending on the specific trading platform or charting software being used.
Most platforms include a searchable indicator panel or library. Traders can locate MACD alongside other common technical analysis tool options without needing any external plugins or downloads.
This MACD setup guide covers three common environments. These are a web-based charting platform, a desktop trading terminal, and a typical broker or mobile trading application.
Regardless of platform, most setups allow adjustment of the underlying chart settings. Period lengths and line colors can be tailored to a trader’s specific preferences.
The following three subsections walk through the process on TradingView, MetaTrader, and typical broker charting tools. They cover the core steps common to most modern trading environments.
Adding MACD in TradingView
In TradingView MACD setup begins with the indicator search bar. Typing “MACD” brings up the standard indicator, ready for immediate application to any open chart.
Once added, traders can adjust customizing colors and periods directly within the indicator’s settings panel. The twelve, twenty-six, and nine defaults can be changed to match a preferred trading style.
TradingView also allows saving custom MACD templates. Adjusted settings can then be quickly reapplied across multiple charts without repeating the same configuration steps each time.
Adding MACD in MetaTrader (MT4/MT5)
Within MetaTrader MACD access typically starts from the indicators menu. It appears under the oscillators category alongside other common technical analysis tool options available by default.
On the MT4 indicator list, MACD appears as a standard built-in tool requiring no additional installation. This makes it one of the more accessible indicators for new traders.
MT5 setup follows a similar process. The platform organizes indicators slightly differently and offers a few additional customization options compared to its earlier counterpart.
8.3 Adding MACD in a Broker or Charting App
Most broker charting tools include MACD as a standard offering. It is typically accessible through a menu labeled indicators, studies, or technical tools depending on the platform’s design.
On a mobile trading app, indicators are often accessed through a dedicated chart icon. MACD appears in a searchable list alongside other commonly used momentum and trend tools.
Regardless of the specific indicator library used, the underlying calculation remains consistent. MACD readings should match closely across most reputable platforms and applications.
MACD vs. Other Indicators
Comparing MACD vs RSI, MACD vs moving average, and MACD vs stochastic oscillator helps traders understand what makes this particular tool distinct within technical analysis.
This indicator comparison is not about determining which indicator is better in an absolute sense. It is about understanding what each tool measures and where its strengths and limitations lie.
MACD’s unique value comes from blending trend and momentum information into a single view. Most standalone oscillators or simple moving averages cannot fully replicate that on their own.
Understanding these differences helps traders build more effective combinations. They can pair tools that complement each other’s weaknesses rather than duplicating the same underlying market information.
The following three subsections examine MACD against RSI, moving averages, and the stochastic oscillator individually. They highlight the practical distinctions relevant to everyday chart analysis.
MACD vs. RSI
Comparing MACD versus RSI highlights a fundamental distinction. MACD functions primarily as a trend indicator vs momentum oscillator comparison, while RSI measures speed and change of price movements directly.
RSI relies on an overbought oversold framework bounded between zero and one hundred. MACD instead uses crossover signals without any fixed upper or lower boundary limiting its readings.
Many traders use both together. RSI’s bounded readings complement MACD’s unbounded trend-following nature, offering a more complete view of momentum extremes and directional bias.
MACD vs. Moving Averages
MACD versus simple moving average analysis reveals that MACD essentially measures the relationship between two moving averages. It does not track price against a single one directly.
This creates a meaningful lag comparison. MACD reacts faster than a single longer-term moving average, but it still lags behind raw price due to its reliance on smoothed EMA inputs.
Regarding signal timing, MACD crossovers often occur earlier than simple moving average crossovers. Both remain inherently lagging tools built entirely from historical price information.
MACD vs. Stochastic Oscillator
MACD versus stochastic comparisons highlight a bounded vs unbounded oscillator distinction. The stochastic oscillator remains confined between zero and one hundred, while MACD can extend well beyond typical ranges.
This difference makes the stochastic oscillator better suited for spotting overbought and oversold extremes. MACD focuses more on broader directional momentum across a wider price range.
In terms of short-term vs medium-term signals, stochastic tends to generate faster, more frequent readings. MACD generally reflects a somewhat longer, smoother momentum picture overall.
Limitations and Common Mistakes When Using MACD
Like any technical tool, the MACD indicator carries real limitations. Traders should understand these MACD limitations before relying on it heavily within any broader decision-making process.
False signals occur regularly, particularly during periods of low volatility or unclear directional bias. Crossovers happen frequently then without translating into meaningful, sustained price movement afterward.
The indicator’s core lagging indicator drawback stems directly from its reliance on moving averages. These smooth and delay price information by nature, rather than reacting to it instantly.
Recognizing these limitations does not make MACD less useful. Instead, it encourages traders to apply the indicator alongside other tools rather than treating it as a standalone decision-maker.
The following three subsections examine false signals in ranging markets, the lagging nature of the indicator, and common mistakes traders make when applying MACD in practice.
False Signals in Sideways or Choppy Markets
In a ranging market, MACD tends to generate frequent whipsaw signals. The fast and slow EMAs repeatedly cross without any sustained directional move to justify the crossovers occurring.
These false crossovers can mislead traders into entering and exiting positions repeatedly. This often results in accumulated transaction costs without corresponding gains from any genuine price movement.
Recognizing choppy conditions ahead of time helps traders avoid over-relying on MACD signals. Price structure or volatility measures can flag periods unsuited to trend-following analysis.
MACD Is a Lagging Indicator
The lag in signals produced by MACD stems from its foundation in exponential moving averages. These are inherently based on past prices, not predictive of future movement.
This means confirmation often arrives after a meaningful portion of a price move has already occurred. It represents a form of delayed confirmation rather than an early warning system.
Traders who understand this limitation tend to use MACD differently. They confirm trends already in motion rather than expecting it to predict reversals before they begin unfolding.
Common Mistakes Traders Make With MACD
Using MACD in isolation, without any supporting context from price structure or additional indicators, ranks among the most frequent errors traders make when applying this tool.
Ignoring overall trend direction while acting on every crossover signal often leads to poor results. Counter-trend signals tend to fail more often than those aligned with dominant price direction.
Overtrading on every crossover compounds these issues further. Combined with using the wrong settings for timeframe, it turns a useful confirmation tool into a source of costly false signals.
Which Markets and Asset Classes Work Best With MACD
MACD for stocks tends to work well given the relatively steady trending behavior many individual equities display. Broad market indexes often show this pattern too, across daily and weekly timeframes.
Currency pairs behave somewhat differently. MACD for forex benefits from deep liquidity and pronounced trending behavior in major pairs, though news-driven volatility can occasionally distort short-term readings.
Digital assets require additional caution when applying MACD for cryptocurrency. These markets frequently experience sharp volatility spikes that can generate misleading crossovers not tied to sustained trend changes.
Commodities present another use case. Regarding MACD for commodities, the indicator performs reasonably well on assets with clear cyclical or seasonal patterns, though sudden supply shocks can disrupt readings.
Overall asset class suitability depends less on the asset type itself. It depends more on whether that specific market is currently displaying trending versus range-bound behavior.
Frequently Asked Questions
What does MACD stand for?
MACD is an acronym meaning Moving Average Convergence Divergence. This reflects how the indicator tracks the convergence and divergence between two exponential moving averages calculated from closing prices.
This full name describes the core mechanism directly. Two moving averages move toward or away from each other, which is exactly what the MACD line visually represents on any chart.
What is considered a good or strong MACD reading?
A strong MACD signal typically shows a wide histogram magnitude. This indicates a large gap between the MACD line and signal line relative to the asset’s normal, recent trading range.
Because MACD lacks fixed boundaries, its readings are best judged through relative reading comparisons. Traders compare current readings against that specific asset’s own historical range rather than any universal threshold.
Is MACD a leading or lagging indicator?
MACD is widely considered a lagging indicator. It is fundamentally trend-following in nature rather than predictive, relying entirely on smoothed historical price data for its calculations.
This means MACD confirms moves that are already underway, based on historical data. It does not forecast future price direction before that movement has actually begun.
What is the best MACD setting for day trading?
Common day trading settings shift toward faster EMA periods, such as five, thirteen, and one. These settings increase intraday sensitivity for shorter holding periods within a single session.
These faster configurations react more quickly to short-term price swings. That responsiveness also increases the frequency of false signals compared to standard default settings used on daily charts.
How accurate is the MACD indicator?
MACD accuracy varies significantly depending on market conditions. It generally performs better during clear trending market performance and less reliably during extended sideways or range-bound consolidation phases.
Rather than viewing MACD in terms of a fixed win rate, most traders treat it as a confirmation tool. It works best alongside other analysis rather than as a standalone predictive system.
Can MACD be used for cryptocurrency trading?
Yes, MACD crypto applications are common. The indicator often requires volatility adjustment through modified settings, given how sharply digital assets can move within short periods.
Because digital assets frequently experience rapid volatility spikes, traders often widen their interpretation of crossovers. Some combine MACD with additional tools when analyzing cryptocurrency price charts.
What is MACD divergence and why does it matter?
The divergence definition describes a situation where price and the MACD indicator move in opposite directions. This often serves as an early reversal warning worth monitoring closely.
This pattern reflects momentum weakening beneath the surface of price action. A current trend may be losing underlying strength even while price continues moving in its original direction.
What’s the difference between the MACD line and the MACD histogram?
Comparing the MACD line vs histogram shows that the line reflects the raw difference between two EMAs. The histogram offers a visual representation of that line’s distance from the signal line.
In short, the histogram illustrates the distance between MACD and signal line graphically. This makes momentum shifts easier to spot at a glance than reading the raw line values alone.
Should MACD be used alone or combined with other indicators?
Most experienced traders favor combining indicators rather than relying on MACD alone. Pairing it with tools like RSI or trendlines supports stronger confirmation signals overall.
This approach focuses on reducing false positives. Agreement across multiple independent tools tends to filter out weaker signals that a single indicator might otherwise generate on its own.
What is the best timeframe to use MACD on?
There is no single best timeframe for MACD. The ideal chart interval depends heavily on trading style alignment, whether that style favors short-term or longer-term positions.
Day traders often favor shorter charts with faster settings. Swing traders and long-term investors typically favor daily or weekly charts paired with the standard default configuration.
Who invented the MACD indicator?
Gerald Appel developed the MACD indicator during the late 1970s. It remains one of the most enduring tools within the broader MACD history of technical analysis.
Its indicator origin reflects Appel’s goal of combining trend and momentum measurement into a single, practical framework. Traders across many markets continue to rely on it today.