
What Is Investment Analysis? (Quick Context Before the Comparison)
Every serious investor eventually asks the same question: how do I know if this security is actually worth buying? Investment analysis is the structured process of answering that question, blending security evaluation with judgment about future performance and risk.
At its core, investment analysis exists to estimate intrinsic value of what a business or asset is genuinely worth, independent of its current market price. This estimate then guides the investment decision an investor ultimately makes.
Analysts rely on due diligence to gather evidence before committing capital. This process draws on financial research, company disclosures, and broader market research to reduce uncertainty around an asset evaluation.
Behind every analytical framework sits an investor’s objective growth, income, capital preservation, or some blend of the three. That objective shapes how heavily risk assessment and return expectation factor into the final judgment.
Two distinct traditions have emerged to organize this work: one built on numbers, one built on narrative and context. Understanding both is the foundation for any credible analytical approach to markets.
Why Investors Analyze Securities Before Buying
Buying a security without analysis is closer to gambling than investing. Systematic capital allocation requires evidence, not instinct, because mispriced assets are common but not obvious to the casual observer.
Investment risk exists in many forms: business risk, valuation risk, liquidity risk and each demands a different kind of scrutiny. Ignoring any one of them tends to surface later as an unpleasant surprise.
Informed investing also protects against emotional decision-making. Whether the work is done through buy-side research or sell-side research, the goal is the same: build a defensible investment thesis before money moves.
The Two Core Approaches Qualitative and Quantitative, Defined at a Glance
Broadly, analysts split their work into two camps. One relies on subjective analysis of things that resist easy measurement; the other relies on objective analysis built from hard numbers and statistics.
This is the classic split between numerical data vs subjective judgment, a distinction that shapes tools, training, and even personality types drawn to each discipline. Neither approach is inherently superior on its own.
In practice, the strongest valuation process rarely picks a single lane. It blends data-driven investing with judgment-driven investing, treating the two as complementary analysis methods rather than rival philosophies.
What Is Qualitative Investment Analysis?
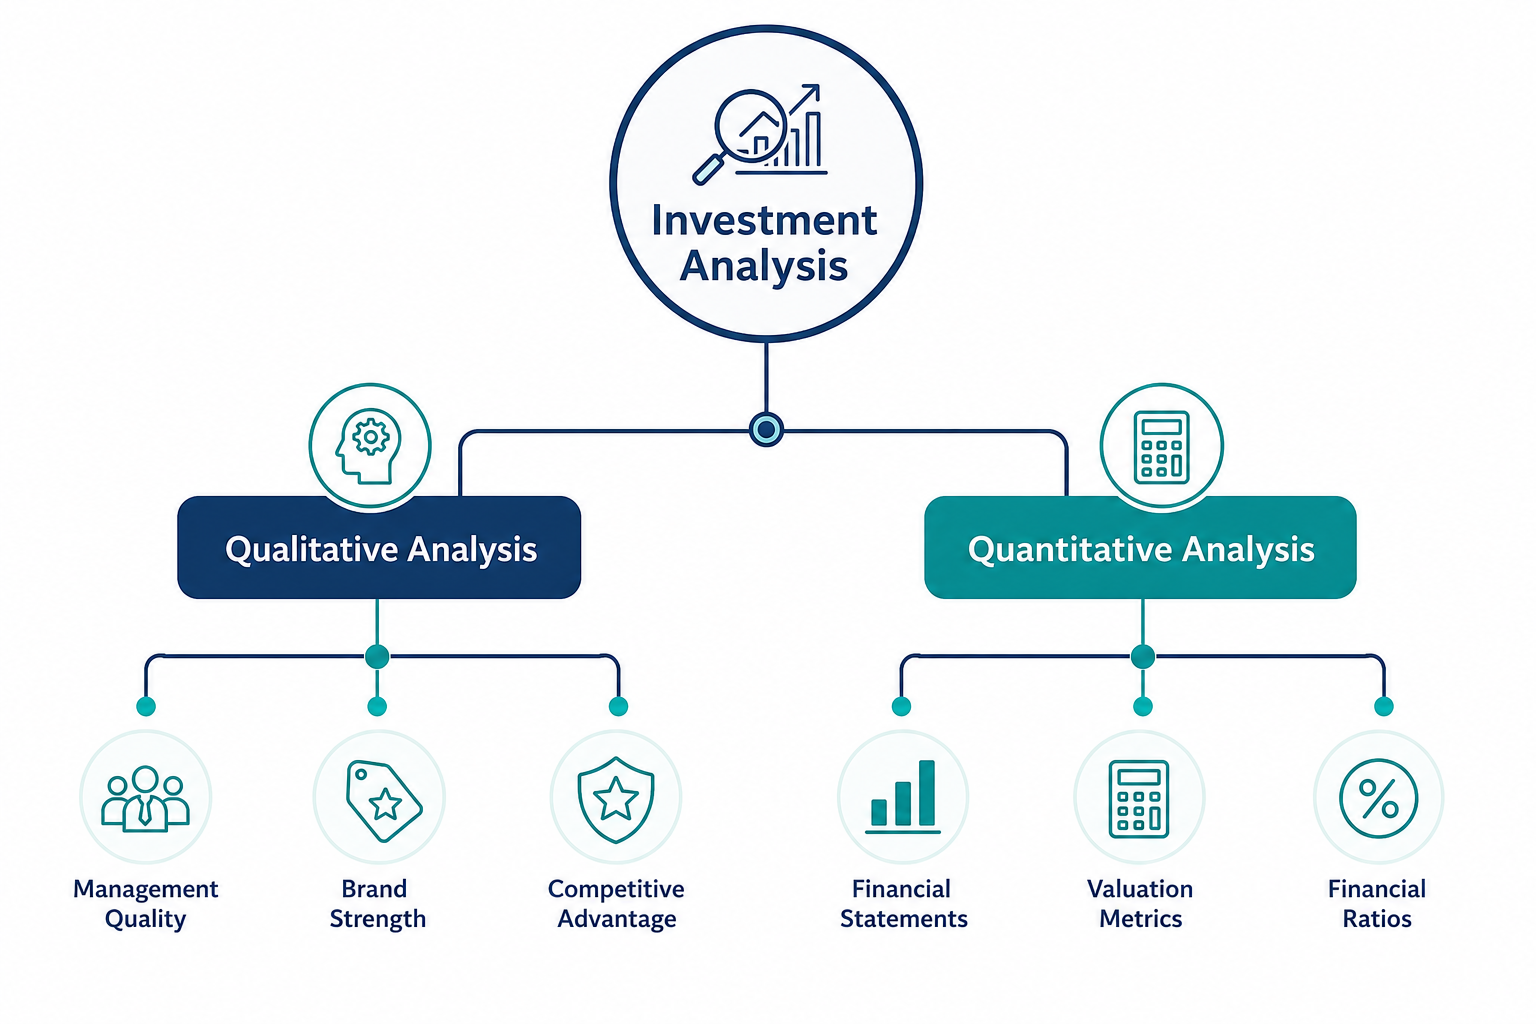
Qualitative analysis examines the parts of a business that don’t show up cleanly on a spreadsheet. It’s a qualitative analysis definition built around judgment, interpretation, and pattern recognition rather than arithmetic.
The focus sits on non-numerical factors: the strength of leadership, the durability of a company’s edge, and the quality of its relationships with customers and regulators. These are inherently subjective analysis exercises.
Intangible assets like reputation, patents, and institutional knowledge rarely appear at fair value on a balance sheet. Yet they often explain why one company sustains profitability while a rival with similar numbers does not.
At the center of this work is business quality, a holistic judgment about whether an enterprise is built to last. Assessing competitive advantage and economic moat sits squarely within this tradition of analysis.
This is fundamentally narrative-based analysis: analysts construct a coherent story about a company’s future by weighing management quality, corporate governance, brand value, company culture, and industry position together.
Key Qualitative Factors Analysts Evaluate (Management, Moat, Brand, Governance, Culture)
Leadership evaluation starts with a simple question: has this management team allocated capital wisely in the past? Track records matter more than promises, and management quality is judged against both.
An economic moat cost advantages, network effects, switching costs, or intangible brand power protects margins from competitors. Analysts probe brand strength and market share to gauge how durable that protection really is.
Beyond the business itself, analysts weigh corporate governance, labor relations, the regulatory environment, and supply chain quality. Increasingly, ESG factors environmental, social, and governance considerations factor into this same qualitative lens.
How Qualitative Analysis Is Conducted (Interviews, 10-K Narrative Sections, Industry Research, SWOT, Porter’s Five Forces)
Much of this work begins with reading, not calculating. Analysts pore over 10-K qualitative disclosures, especially the MD&A section and risk factors section, where management explains its own business in plain language.
Structured frameworks add rigor to what could otherwise feel like guesswork. SWOT analysis and Porter’s Five Forces give analysts a repeatable lens for assessing competitive landscape analysis and strategic positioning within an industry.
Primary evidence often comes from management interviews and expert interviews, supplemented by industry research. This mix of primary research and secondary research forms the backbone of thorough qualitative due diligence.
Strengths of Qualitative Analysis
Numbers describe the past; qualitative work often anticipates the future. A skilled analyst gains deep business insight by understanding why a company’s numbers look the way they do, not just that they do.
This approach naturally favors a long-term perspective. Most identification and strategic insight tend to reward patience, since durable competitive advantages play out over years, not quarters.
Perhaps most valuable is its role in uncovering hidden risks. A holistic company view can flag governance red flags or cultural dysfunction long before those problems ever appear in a financial statement.
Limitations and Biases in Qualitative Analysis
The same flexibility that makes qualitative analysis powerful also makes it vulnerable. Subjective bias creeps in easily, and two analysts examining the same company can reach very different conclusions about its quality.
Confirmation bias and the narrative fallacy are persistent risks once an analyst falls in love with a story, disconfirming evidence tends to get downplayed. The halo effect compounds this, letting one strength excuse many weaknesses.
Because it’s difficult to quantify, qualitative work is also time-consuming analysis that resists easy comparison across companies. This lack of standardization and risk of inconsistent evaluation are real costs of the approach.
What Is Quantitative Investment Analysis?
Where qualitative analysis reads a company’s story, quantitative analysis reads its numbers. This quantitative analysis definition centers on numerical data, financial ratios, and mathematical models applied consistently across many securities.
The appeal is objectivity. Two analysts running the same statistical analysis on the same dataset should reach the same conclusion, which is rarely true of purely narrative-driven work.
Financial ratios compress complex financial statements into comparable figures. This is what makes financial statement analysis so scalable. Thousands of companies can be screened using identical, measurable metrics.
Mathematical models extend this further, projecting future cash flows or estimating fair value through formal, replicable procedures. This is the foundation of quant investing and algorithmic analysis at scale.
Ultimately, this branch of analysis treats investing as an evidence-based discipline. It prioritizes data-driven investing over intuition, trading some nuance for consistency, speed, and the ability to cover far more ground.
Key Quantitative Metrics and Ratios (P/E, EPS, ROE, Debt-to-Equity, Free Cash Flow, Margins)
The P/E ratio price relative to earnings per share (EPS) remains the most widely cited valuation multiple, offering a quick read on how expensive a stock is relative to its profits.
Profitability and balance sheet strength come from other angles. Return on equity (ROE) measures how efficiently a company generates profit from shareholder capital, while the debt-to-equity ratio reveals how much leverage supports that return.
Cash tells a different story than earnings. Free cash flow (FCF), profit margin, revenue growth, dividend yield, and liquidity measures like the current ratio and quick ratio round out a typical quantitative snapshot.
How Quantitative Analysis Is Conducted (Financial Statement Modeling, DCF, Factor Models, Screening, Backtesting)
Analysts build detailed financial statement modeling to project a company’s income statement, balance sheet, and cash flows forward, often over a five- to ten-year horizon before estimating terminal value.
The discounted cash flow (DCF) model converts those projections into a present-day valuation. Related tools like factor models, the Fama-French model, and CAPM help explain returns through systematic risk exposures.
Before committing capital, quants apply quantitative screening using defined screening criteria, then validate ideas through backtesting and regression analysis to see how a strategy would have performed historically.
Strengths of Quantitative Analysis
Scalability is the standout advantage: a well-built model can evaluate thousands of securities in the time it takes a human analyst to read one annual report closely.
Because it relies on measurable metrics, this approach offers strong comparability and replicability. Two teams running identical inputs should arrive at nearly identical outputs, which supports rigorous benchmarking.
Quantitative work also tends to reduce emotional decision-making. Systematic rules applied consistently can produce more disciplined risk-adjusted return outcomes than judgment exercised inconsistently under pressure.
Limitations of Quantitative Analysis
Numbers can mislead as easily as they inform. Data mining bias and overfitting are constant risks, where a model fits historical noise so tightly that it fails the moment real conditions shift.
Quantitative models are inherently backward-looking data, built from history that may not repeat. This creates real model risk, and statistical significance pitfalls can make random patterns look meaningful.
Perhaps most importantly, this approach ignores qualitative context by design. It missed intangible factors like leadership or culture, a limitation often summarized as garbage in garbage out when the underlying data is flawed.
Qualitative vs Quantitative Investment Analysis: Side-by-Side Comparison
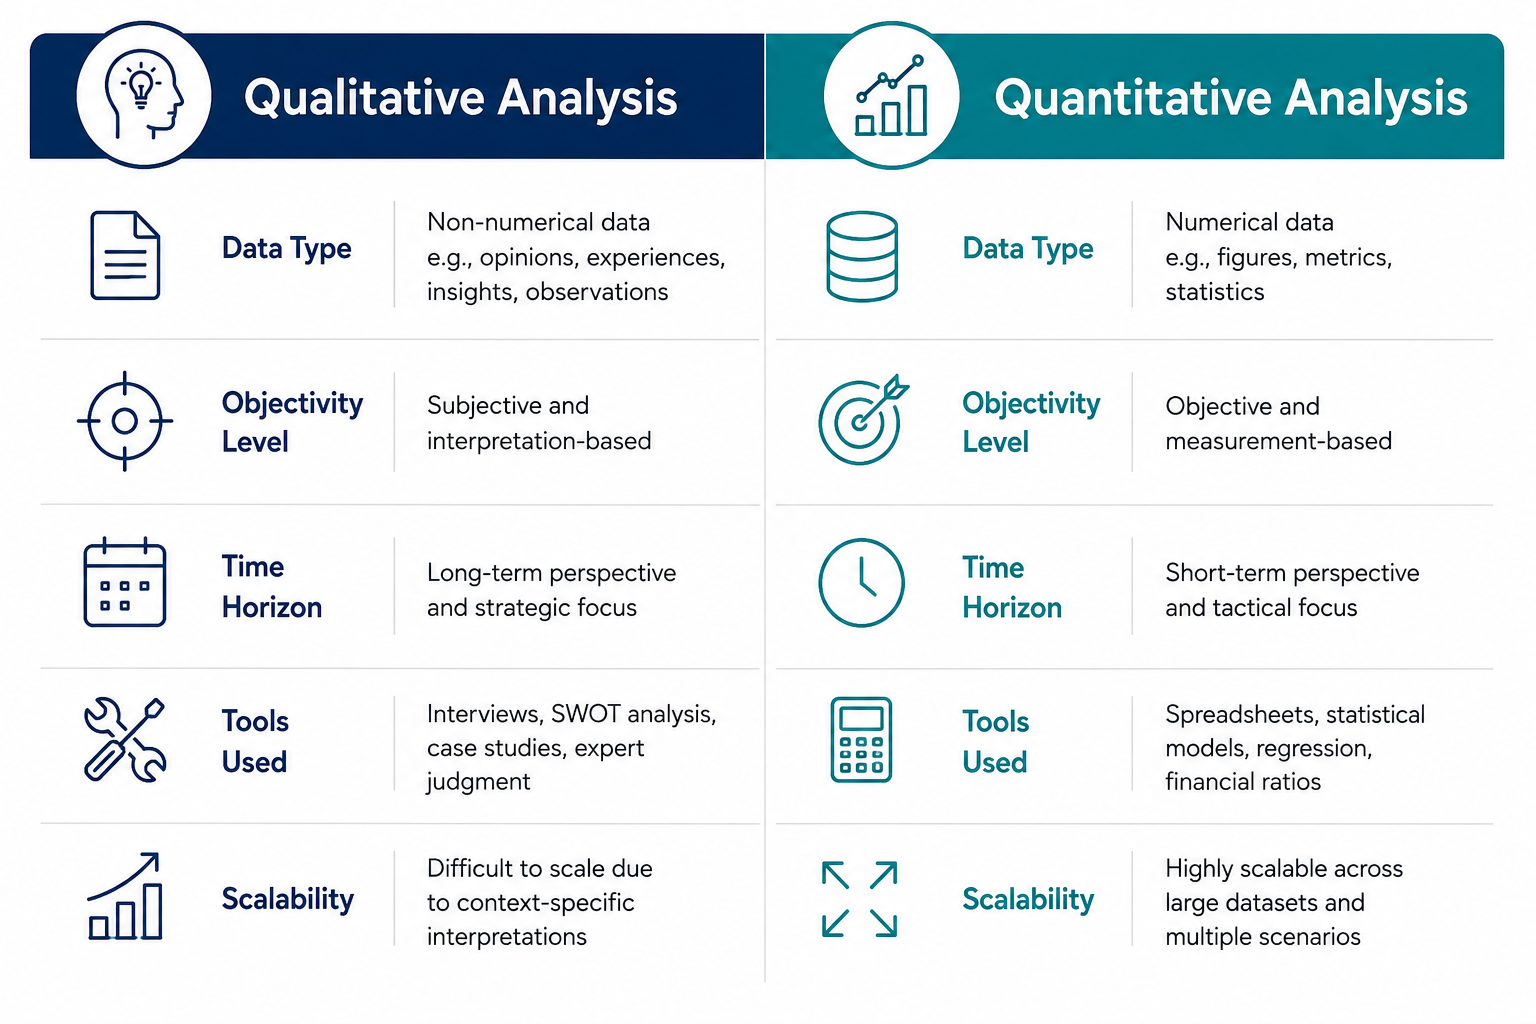
Placed side by side, the two approaches diverge on nearly every dimension that matters to an analyst. This qualitative vs quantitative comparison helps clarify when each method earns its keep.
The clearest distinction is a data type comparison; one method works with words, interviews, and narrative judgment, while the other works exclusively with structured, numerical inputs that can be modeled and tested.
That difference cascades into an objectivity vs subjectivity trade-off. Quantitative outputs are reproducible by design; qualitative conclusions depend heavily on the individual analyst’s judgment and experience.
The time horizon also separates the two. Qualitative work tends to serve long-term investing, while quantitative screens often support faster, higher-volume decision criteria across large investment universes.
Together, these analytical trade-offs don’t cancel each other out; they highlight why so many serious investors eventually adopt some version of a methodology comparison that draws on both.
Comparison Table (Methodology, Data Type, Objectivity, Time Horizon, Scalability, Bias Risk, Tools, Skill Requirements)
| Dimension | Qualitative Analysis | Quantitative Analysis |
| Methodology | Interpretive, narrative-driven | Statistical, model-driven |
| Data source | Interviews, filings, industry context | Financial statements, market data |
| Output type | Judgment, thesis, rating | Score, ratio, valuation figure |
| Time horizon | Long-term, moat-driven | Short-to-medium term, screen-driven |
| Scalability | Low one company at a time | High thousands of securities at once |
| Bias risk | Confirmation bias, narrative fallacy | Overfitting, data mining bias |
| Tools used | SWOT, Porter’s Five Forces, interviews | DCF, factor models, screeners |
| Skill requirements | Industry knowledge, judgment | Statistics, financial modeling |
This table condenses methodology, data source, output type, time horizon, and skill requirements into a single reference, a useful standardization level check before choosing an approach.
Key Differences Explained in Plain Language
Strip away the jargon and the difference is intuitive. Quantitative analysis asks “what do the numbers say?” while qualitative analysis asks “why do the numbers look this way, and will that hold?”
Practical differences show up fastest in speed of analysis; a quant screen runs in seconds, while a genuine qualitative assessment might take weeks of reading, interviewing, and cross-checking assumptions.
Real-world application usually respects both. Analysts increasingly frame this not as competition but as contrasting approaches whose complementary strengths cover each other’s blind spots.
Is Technical Analysis the Same as Quantitative Analysis? (Clearing Up a Common Confusion)
A common mix-up deserves a direct answer: no, technical analysis and quantitative analysis are not the same thing, even though both feel numbers-driven and both avoid company narrative almost entirely.
Technical analysis studies chart patterns, price action, and volume to infer future price movement. It assumes historical trading behavior contains predictive signals about where a security is headed next.
Quantitative analysis, by contrast, is far broader. It applies to valuation multiples, factor models, and financial ratios that have nothing to do with price charts; it’s a methodology, not a single data type.
The two do overlap in execution style. Both can be systematic trading approaches, and both often run through algorithmic trading systems rather than manual, discretionary trading decisions made case by case.
Where they genuinely differ is data source. Indicator-based analysis in technical work draws purely from price and volume; quant trading more broadly can incorporate earnings, balance sheets, and macro data alongside price signals.
Qualitative and Quantitative Analysis in Fundamental Analysis
Fundamental analysis is the umbrella under which qualitative and quantitative work actually coexist. It asks a single unifying question: what is this business truly worth, based on everything knowable about it?
That “everything” spans both economic factors and financial factors. Macroeconomic analysis sets the backdrop, while company-specific factors determine how a business performs relative to that broader environment.
Crucially, qualitative and quantitative factors aren’t separate exercises inside fundamental analysis; they’re inputs to the same judgment. A cheap stock with deteriorating management quality isn’t actually cheap once that’s accounted for.
Fundamental analysts typically work from a top-down analysis or bottom-up analysis starting point, examining industry conditions before or after diving into individual company specifics, depending on their process.
This integrated fundamental analysis framework is often contrasted with a very different school of thought, one focused entirely on price behavior rather than business substance, discussed next.
How the Two Combine Inside the Fundamental Analysis Framework
In practice, an analyst might start with quantitative screening to shortlist candidates, then apply qualitative due diligence to the survivors. This sequencing supports an integrated fundamental framework rather than two disconnected processes.
Combining qualitative and quantitative work this way produces a fuller holistic company evaluation. Numbers flag what looks attractive; qualitative research explains whether that attractiveness is sustainable or a temporary distortion.
The result is a genuine financial health assessment paired with a business quality assessment together, they capture both what a company has achieved and why it might keep achieving it.
Fundamental Analysis vs Technical Analysis (Where Qual/Quant Fit)
Fundamental analysis vs technical analysis is really a contrast between intrinsic value vs market price. Fundamentals ask what something is worth; technicals ask what the market currently believes it’s worth, and where that belief is headed.
This maps onto a long-term investing vs short-term trading divide. Fundamental work, whether qualitative or quantitative, tends to inform patient positions; technical work often supports faster, price-driven trading decisions.
Notably, value investing sits firmly on the fundamental side, drawing on both qualitative judgment and quantitative screens but it treats price trend analysis as largely irrelevant to the underlying investment case.
Which Is Better Qualitative or Quantitative Analysis?
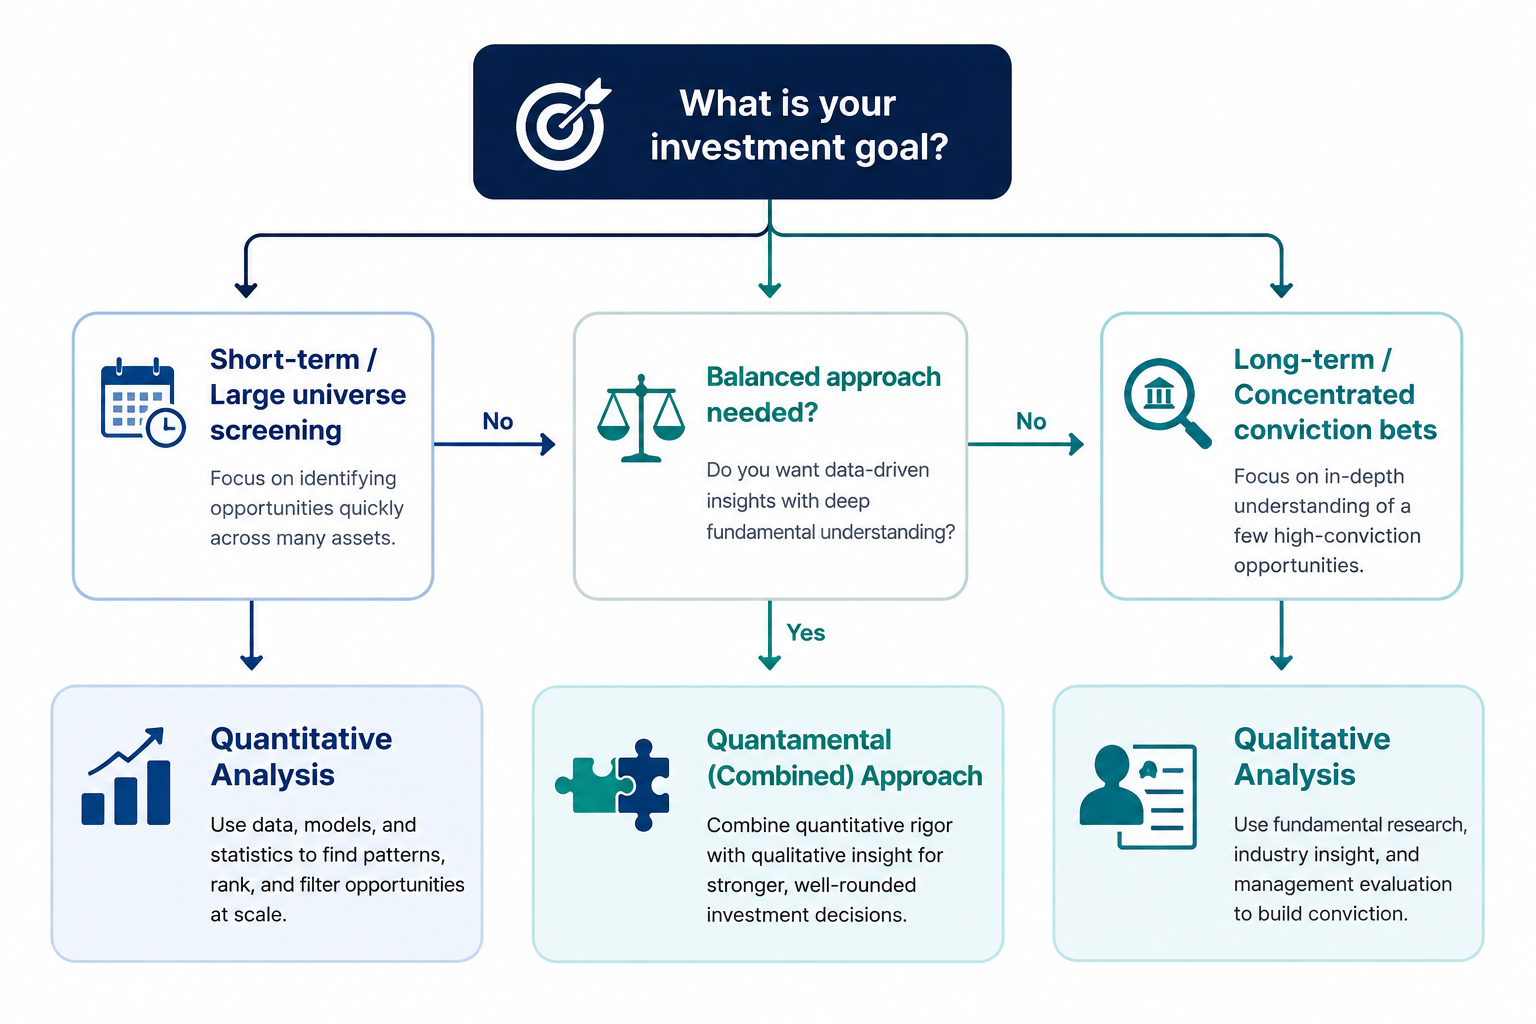
This is the question every investor eventually asks, and the honest answer resists a simple verdict. The right investment approach comparison depends heavily on context, not on declaring one method universally superior.
Choosing an analysis method should start with investor style. A retail investor holding five stocks needs something very different from a fund manager evaluating five thousand potential positions each quarter.
Time horizon considerations matter just as much. Someone trading around quarterly catalysts leans quantitative by necessity; someone building a decade-long position has room for deeper qualitative conviction.
Asset class considerations also shift the balance. Some asset classes lend themselves to clean quantitative screening; others are so idiosyncratic that qualitative judgment becomes unavoidable regardless of preference.
Ultimately, this isn’t a binary choice so much as a decision framework, a way of weighting two legitimate tools differently depending on the specific investing problem at hand.
When Quantitative Analysis Should Lead (Screening, Large Universes, Short Time Horizons)
When the task is large-scale screening across thousands of names, quantitative methods win by necessity. No team of human analysts can perform deep qualitative review on that many companies simultaneously.
Efficient markets with abundant data and heavy analyst coverage also favor quantitative approaches, since qualitative edges are harder to find where information is already widely digested and priced in.
Factor investing and other scalable analysis techniques suit a short holding period, where speed and consistency across a large portfolio matter more than deep conviction in any single name.
When Qualitative Analysis Should Lead (Concentrated Bets, Long Time Horizons, Moat-Driven Investing)
Concentrated bets demand a different posture entirely. When capital is committed heavily to just a handful of companies, understanding the qualitative “why” behind the numbers becomes essential, not optional.
This is the traditional home of value investing, associated historically with the Benjamin Graham approach and later refined by the Warren Buffett approach, both of which emphasize durable business quality.
A genuine long-term holding period rewards moat-driven investing, where the payoff comes from qualitative durability compounding over years, something a quarterly quantitative screen simply cannot capture.
Decision Framework: Choosing Your Weighting by Investor Type, Asset Class, and Time Horizon
Start with the investor type. A retail investor managing a small, concentrated portfolio typically benefits from learning qualitative; an institutional investor managing broad mandates often needs quantitative infrastructure just to stay organized.
Layer in asset class, risk tolerance, and time horizon next. These three variables interact, and no single weighting framework applies identically across every situation an investor might face.
The most useful outcome isn’t a fixed rule but a flexible decision matrix, a repeatable hybrid weighting strategy an investor can revisit as circumstances, conviction, and available data change.
Combining Both Quantamental Investing Explained
The debate over which method is “better” increasingly misses the point, because sophisticated investors rarely choose one exclusively. Quantamental investing formalizes that blend into a distinct, deliberate discipline.
At its simplest, this is a hybrid investing approach: quant and fundamental combined into a single research process, rather than run as two separate, competing departments within the same firm.
It represents systematic and discretionary investing, working together models to generate ideas or flag risks, while human judgment interprets and refines what those models produce before capital moves.
This approach also describes data-driven fundamental research, where a quantitative overlay filters a broad universe before analysts apply a more traditional fundamental screen to the surviving candidates.
The result is neither purely mechanical nor purely narrative-driven; it’s a structured attempt to capture the strengths of both traditions while limiting each one’s characteristic blind spots.
What Is Quantamental Investing?
The quantamental definition describes an investment process that formally integrates statistical modeling with fundamental judgment, rather than treating them as sequential or entirely separate steps in research.
This reflects the broader evolution of investment analysis over recent decades, as computing power made large-scale screening feasible while investors remained unwilling to abandon judgment-based conviction entirely.
Increasingly, firms are creating a genuine hybrid analyst role professionals trained in both statistical modeling and traditional fundamental research, rather than specialists confined to just one discipline.
How Institutional Investors and Hedge Funds Blend Qualitative and Quantitative Approaches
Inside many funds, this blend shows up structurally. A quant analyst role might build screening tools that a separate fundamental analyst role then uses to prioritize deeper company research.
Some firms embed a resident quant directly within fundamental teams, building spreadsheet-based screens that flag anomalies or opportunities the fundamental analysts might otherwise take much longer to notice manually.
This extends to newer considerations too, including formal ESG scoring integration, a quantitative overlay applied to what has traditionally been a qualitative governance and sustainability assessment within institutional investing.
Performance Evidence: What Research Says About Quant vs. Fundamental Managers
Assessing systematic manager performance against discretionary manager performance is an active area of ongoing empirical research, and results vary meaningfully depending on time period, market regime, and asset class examined.
Some academic study work suggests systematic strategies handle certain recessionary period performance patterns differently than discretionary ones, though findings aren’t uniform across every study or every market cycle.
Rather than declaring a clear winner, most performance comparison data points toward complementary strengths reinforcing why quant fund outperformance, where it occurs, tends to be conditional rather than permanent or universal.
Qualitative vs Quantitative Analysis Beyond Stocks
Equities dominate this conversation, but the qualitative-quantitative divide applies just as directly across other asset class application contexts. The underlying logic transfers even when the specific metrics change entirely.
Every asset class has its own version of a financial ratio and its own version of a qualitative judgment call. Understanding both prevents an investor from treating one asset class’s rules as universal.
This kind of multi-asset analysis matters increasingly as portfolios diversify beyond public equities into less liquid, less standardized markets where information can be genuinely harder to obtain.
The next four sections walk through how this divide plays out in fixed income analysis, real estate analysis, private equity analysis, and cryptocurrency analysis each with its own quirks.
What stays constant is the underlying tension: numbers alone rarely tell the whole story, and story alone rarely survives contact with a genuinely rigorous set of numbers.
Fixed Income
Bond analysis leans heavily on quantitative inputs like yield analysis, duration, and interest rate risk, all of which can be modeled with considerable mathematical precision compared to equity valuation work.
Yet credit rating decisions still require judgment. Agencies weigh qualitative credit factors management competence, industry outlook, and governance alongside financial ratios when assessing a bond issuer’s genuine creditworthiness.
Ultimately, assessing issuer quality blends both traditions: quantitative leverage and coverage ratios establish a baseline, while qualitative judgment determines whether that baseline is likely to hold under future stress.
Real Estate
Property valuation relies on quantitative anchors like cap rate, comparable sales data, and projected rental income figures that can be compared reasonably cleanly across similar properties in a given market.
But location analysis and neighborhood trajectory resist pure quantification. Two properties with identical cap rates can have very different long-term outcomes depending on qualitative real estate fundamentals like development trends nearby.
Assessing market demand genuinely requires both lenses: quantitative rental comparables establish current pricing, while qualitative location factors help predict whether that pricing holds or shifts meaningfully over time.
Private Equity and Venture Capital
Deal due diligence in private markets is unusually qualitative, since target companies are often too young or too private to offer the rich historical data public market quant analysis depends on.
Management team evaluation frequently outweighs current financials entirely, especially in venture investing, where a market opportunity assessment matters more than a still-thin quantitative track record.
Later-stage deals shift the balance somewhat. Financial projections and exit strategy analysis bring in more quantitative rigor, though qualitative conviction about the team and market remains central throughout.
Cryptocurrency and Digital Assets
Digital assets have developed their own hybrid vocabulary. Tokenomic and on-chain data provide quantitative signals, supply schedules, transaction volume, and wallet activity largely unavailable in traditional asset classes.
Yet qualitative project evaluation remains essential too. Reading a project’s whitepaper analysis carefully reveals governance structure, developer credibility, and use-case viability that raw network statistics alone cannot capture.
Combining quantitative crypto metrics with qualitative scrutiny of the team and technology mirrors, almost precisely, the same dual-lens approach investors have long applied to traditional equities and bonds.
The Role of AI, Machine Learning, and Alternative Data in Modern Investment Analysis
Artificial intelligence in investing is actively reshaping the line between qualitative and quantitative work, converting information that once required human judgment into something a model can process directly.
Machine learning systems now digest thousands of documents in the time a human analyst might spend on one, extracting patterns from text, tone, and structure across enormous volumes of company disclosures.
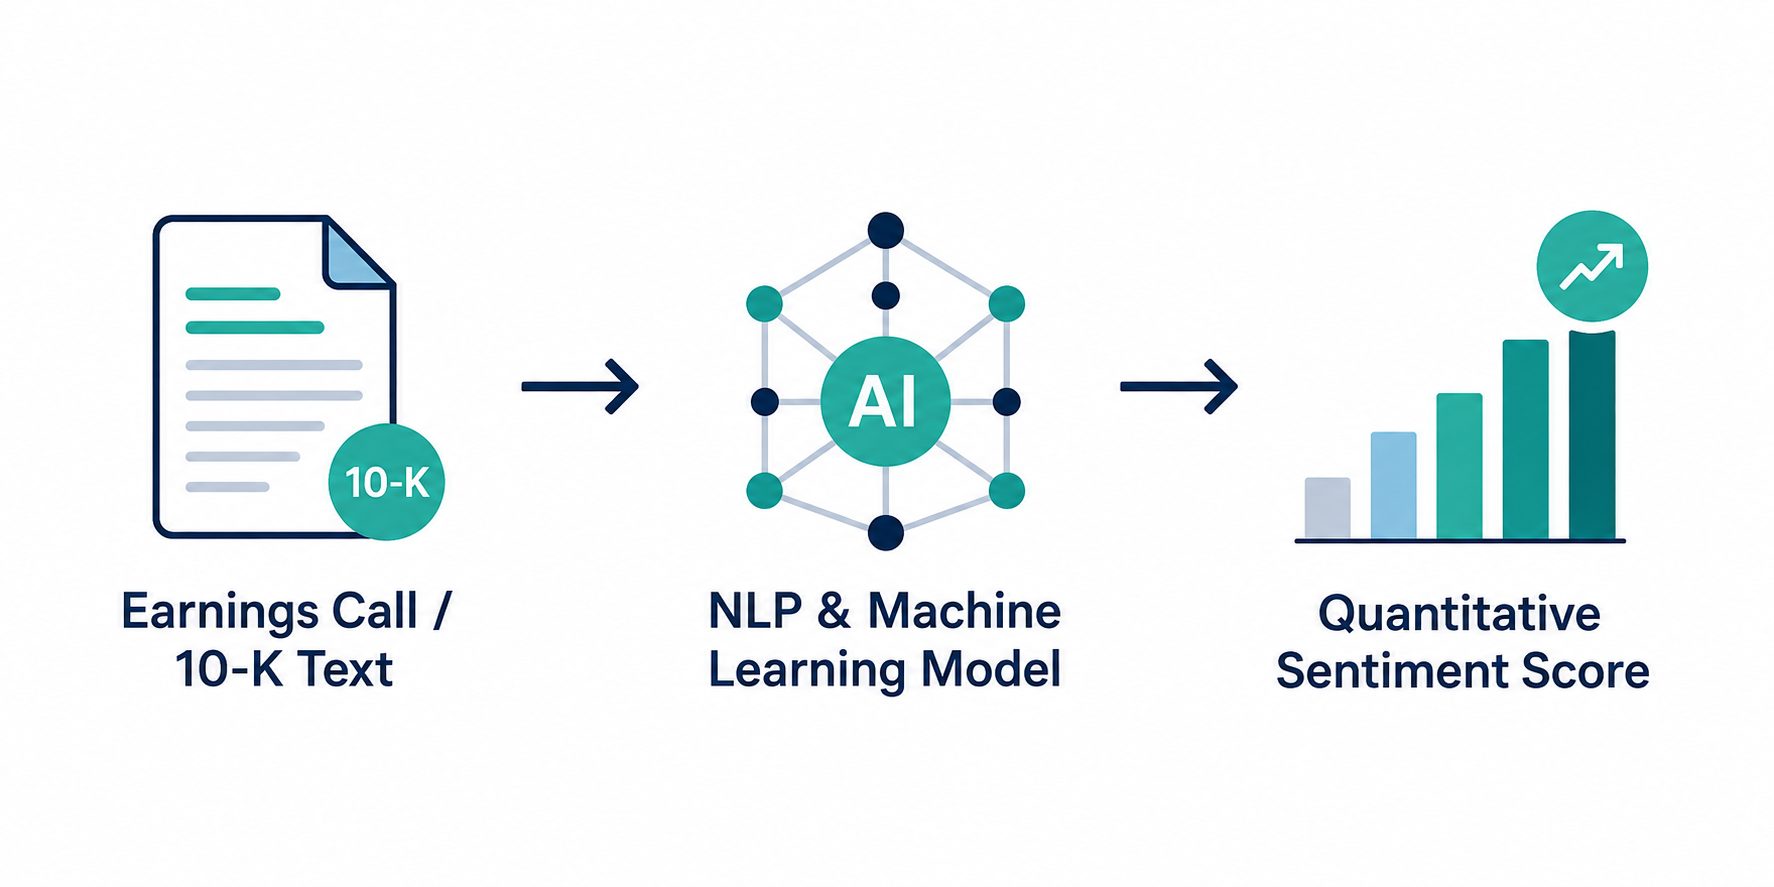
Natural language processing (NLP) sits at the center of this shift, allowing sentiment analysis to be applied systematically to material that used to require purely subjective, manual interpretation.
This growing category of alternative data and big data analytics is expanding what counts as measurable input, blurring a distinction that once felt fairly clean between the two disciplines.
The result is a genuinely new kind of AI-driven investment analysis, one where algorithmic decision-making increasingly incorporates signals that were, until quite recently, considered exclusively qualitative territory.
Turning Qualitative Data Into Quantitative Signals (NLP, Sentiment Analysis on Earnings Calls and Filings)
Earnings call sentiment analysis now scores executive tone, word choice, and hesitation patterns during live calls, converting something once purely impressionistic into a repeatable, comparable numerical output across companies and quarters.
Similarly, 10-K text analysis applies NLP-based scoring to lengthy narrative disclosures, flagging shifts in language around risk factors that might otherwise go unnoticed by a human reader skimming hundreds of pages.
This broader process of converting qualitative data to quantitative signals relies on text mining and modern natural language processing models, effectively industrializing work that analysts used to perform manually, one filing at a time.
Alternative Data Sources Reshaping Quantitative Analysis
Satellite imagery data can now count cars in a retailer’s parking lot or track shipping activity at a port, offering a genuinely quantitative proxy for business activity well before official numbers are released.
Web scraping data and social media sentiment extend this further, capturing consumer chatter and pricing signals in near real time rather than waiting for quarterly disclosures to confirm what’s already happening.
Even credit card transaction data, sourced through specialized alternative data providers, now feeds directly into machine learning models, giving quantitative analysts a genuinely earlier read on consumer spending trends.
Worked Example Analyzing a Company Using Both Lenses
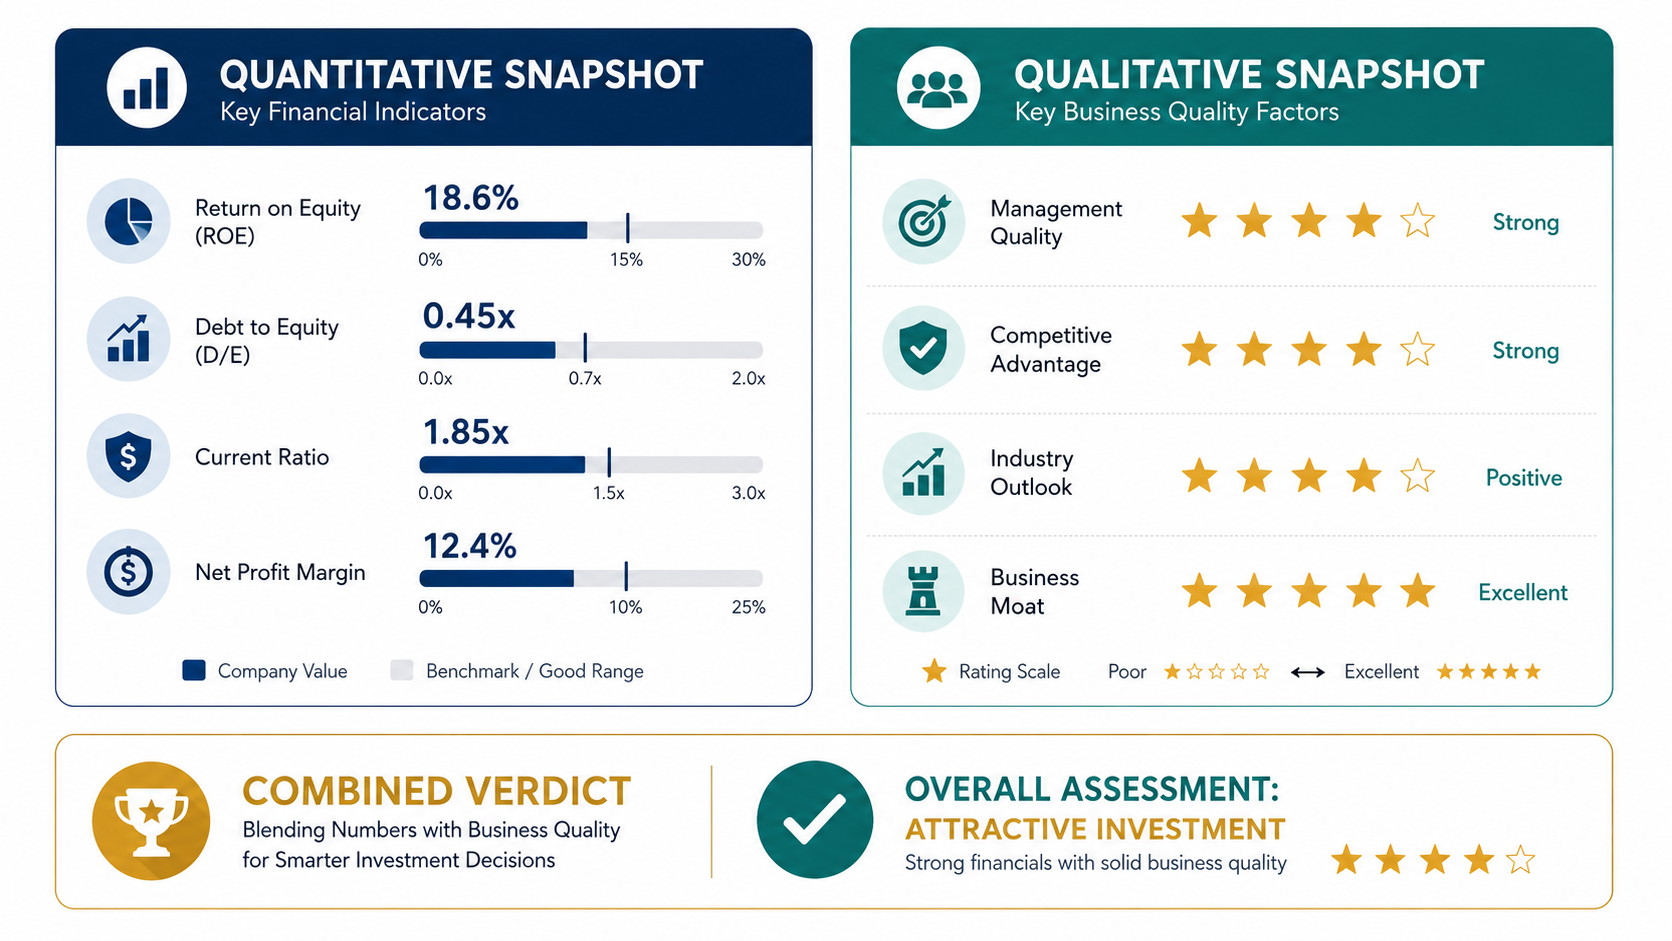
To make this concrete, consider a hypothetical mid-cap consumer goods company not a real security, but a useful case study for showing how both lenses actually interact in practice.
This hypothetical company analysis walks through a sample financial ratios snapshot first, then a sample qualitative assessment, before combining both into a single, coherent investment perspective.
The goal isn’t to reach a buy or sell conclusion that would cross into advice this guide deliberately avoids but to illustrate how the two disciplines genuinely inform one another.
Notice, as you read, how each quantitative figure raises a qualitative question, and how each qualitative observation helps explain why a particular number looks the way it does.
This kind of practical application is exactly what separates textbook theory from the messier, more interesting work analysts actually do when they sit down with a real annual report.
The Quantitative Snapshot (Sample Ratios and Financial Metrics)
Suppose the company trades at a sample P/E ratio of 18, roughly in line with its sector average, alongside a sample ROE of 14%, suggesting reasonably efficient use of shareholder capital.
Sample debt levels sit at a debt-to-equity ratio of 0.6, indicating moderate leverage, while sample revenue growth has averaged a modest but steady low-single-digit rate over the past several years.
Together, this quantitative scorecard paints a picture of a stable, moderately valued business solid, unremarkable numbers that neither scream opportunity nor signal obvious distress on their own.
The Qualitative Snapshot (Management, Moat, Industry Position)
A closer qualitative look reveals more texture. The sample management assessment shows a leadership team with a decade-long tenure and a consistent history of disciplined, shareholder-aligned capital allocation decisions.
The sample moat evaluation points to strong brand loyalty within a mature, slow-growing category, a moat that supports pricing power but doesn’t obviously support the faster growth some investors might expect.
Its sample industry position as a stable, established player rounds out this qualitative scorecard, suggesting durability over dynamism as the company’s defining qualitative characteristic.
Combined Verdict How the Two Lenses Change the Investment Decision
Neither lens alone tells the full story here. The quantitative snapshot suggests an average business; the qualitative snapshot suggests unusual management discipline hiding behind those otherwise unremarkable numbers.
This is where genuine investment decision synthesis happens recognizing that steady numbers paired with strong qualitative fundamentals can matter more than either factor examined entirely in isolation.
The exercise illustrates weighing qualitative and quantitative signals together, without pointing toward any specific action, a reminder that this combined analysis verdict is illustrative, not a recommendation.
Common Mistakes Investors Make With Qualitative and Quantitative Analysis
Even experienced investors fall into predictable traps when applying these two disciplines. Recognizing these analysis pitfalls early tends to matter more than any single analytical technique on its own.
Most investor mistakes trace back to imbalance leaning too heavily on one method while ignoring what the other would reveal, often because one approach simply feels more comfortable or familiar.
Over-reliance on data is one recurring failure mode, but its mirror image bias in judgment untethered from any numerical check is equally common and often harder for investors to notice.
These aren’t rare, exotic errors reserved for beginners. Even seasoned professionals fall into these common investing errors, often precisely because past success bred overconfidence in a single familiar method.
The three patterns below cover the most persistent analytical blind spots, each worth checking against honestly before finalizing any real investment decision.
Over-Relying on Quantitative Screens Alone
A cheap valuation multiple can be a genuine bargain or a warning sign the market has already priced in trouble the screen simply can’t see. This is quantitative screen over-reliance in action.
Ignoring business quality while chasing statistically attractive numbers often leads to so-called value traps, where a stock looks inexpensive precisely because its underlying business is quietly deteriorating.
This produces a kind of false precision mistaking a clean, calculable number for genuine insight, when data-only decision-making has actually skipped the harder, more important qualitative question entirely.
Letting Narrative and Bias Drive Qualitative Judgments
The opposite failure is just as damaging. Narrative bias and storytelling bias can make a compelling founder story feel like sufficient evidence, even when the underlying numbers quietly disagree.
Overconfidence compounds this problem, especially once an investor has publicly committed to a thesis. Anchoring bias then makes it harder to update that view even as new evidence accumulates.
This is ultimately subjective overreach qualitative conviction detached from any quantitative discipline, leaving an investor exposed with no numerical check to catch a story that simply isn’t holding up.
Ignoring Macroeconomic and Industry Context
Even a well-balanced qualitative-quantitative analysis can fail without macroeconomic context. Interest rates, inflation, and currency shifts affect entire sectors regardless of any individual company’s specific fundamentals.
Industry cycle awareness matters just as much. A quantitatively cheap stock in a structurally declining industry is a very different proposition than the same valuation in a growing one.
This is fundamentally context-blind analysis, the risk of ignoring external factors that sit above the company level entirely, no matter how thorough the underlying qualitative or quantitative work happens to be.
Frequently Asked Questions
These frequently asked questions address the practical concerns investors raise most often once they’ve absorbed the core qualitative-versus-quantitative framework covered throughout this guide.
Each answer below aims for directness over hedging, while staying firmly educational none of these responses should be read as a specific recommendation for any individual’s portfolio or circumstances.
Together, they round out a handful of common investor questions that don’t fit neatly into the structural comparison covered earlier in the article.
Think of this section as a quick-reference supplement rather than new material, a way to revisit specific edge cases without re-reading the entire comparison from the beginning.
The goal, as throughout, is analysis accuracy and clarity helping you understand the tools well enough to apply your own judgment to your own situation.
Is quantitative analysis more accurate than qualitative analysis?
Neither method is inherently more accurate; they measure different things. Quantitative analysis is more precise and reproducible, but that precision only covers what can actually be measured numerically in the first place.
Qualitative analysis captures dimensions quantitative work structurally cannot, like leadership judgment or cultural dysfunction, but sacrifices some of that reproducibility. Precision and accuracy simply aren’t the same underlying concept.
The most reliable results tend to come from combining both, letting quantitative discipline check qualitative enthusiasm, and letting qualitative context explain what a quantitative model’s numbers actually mean.
Can a beginner investor do qualitative analysis without financial training?
Yes, beginner investing through a qualitative lens is genuinely accessible without a finance degree. Reading annual reports, understanding a business model, and assessing management commentary don’t require advanced statistical training.
That said, qualitative work still benefits from structure. Learning frameworks like SWOT analysis or Porter’s Five Forces gives a beginner a repeatable process rather than relying purely on gut instinct.
Over time, pairing this qualitative foundation with basic ratio literacy, understanding P/E, ROE, and debt levels rounds out a beginner’s toolkit considerably without requiring formal quantitative training.
What tools do professional analysts use for each type of analysis?
For quantitative work, professional tools commonly include the Bloomberg terminal and FactSet, both of which aggregate financial data, screening capability, and modeling functions into a single research platform.
Qualitative work relies less on specialized software and more on primary sources annual reports, transcripts, and direct conversations supplemented by industry publications and specialized research databases.
Increasingly, both toolsets overlap. Bloomberg and FactSet now incorporate NLP-driven qualitative scoring features, reflecting the broader convergence between traditionally separate quantitative and qualitative research tools.
Do hedge funds use qualitative or quantitative analysis?
Most sophisticated funds use both, though the specific mix varies by strategy. Some hedge funds are explicitly quant-only, running fully systematic strategies with minimal discretionary human input into individual trades.
Others follow deliberately discretionary, fundamentals-driven approaches instead, leaning heavily on qualitative judgment about management and business quality closer to traditional stock-picking than systematic, model-driven investing.
A growing number sit in between, reflecting broader hedge fund practices around quantamental investing, where quantitative screening and qualitative judgment work together within a single unified process.
How does ESG fit into qualitative analysis?
ESG considerations began almost entirely qualitative subjective judgments about governance practices, labor treatment, and environmental stewardship that resisted easy standardization across different companies and industries.
That’s shifting quickly. Formal ESG integration now increasingly relies on quantitative scoring systems, converting governance and sustainability judgments into standardized, comparable numerical ratings across large investment universes.
Even so, genuine analyst skill requirements for ESG work still demand qualitative judgment interpreting what a governance score actually means for a specific company’s real-world business practices and risks.
Key Takeaways
Qualitative and quantitative analysis aren’t competitors so much as two lenses built for different jobs, each revealing something genuinely important that the other lens structurally cannot see on its own.
Quantitative analysis offers scale, consistency, and objectivity, making it well suited to screening large universes and comparing many companies quickly using the same standardized, measurable metrics.
Qualitative analysis offers depth, context, and forward-looking judgment, making it especially valuable for concentrated, long-term positions where understanding the “why” behind the numbers genuinely matters.
Quantamental investing, along with newer AI and alternative data tools, is steadily narrowing the gap between these two traditions, though a meaningful human judgment component still tends to remain.
For most investors, the practical answer isn’t choosing one approach permanently, but learning when to lean on each and building the judgment to know which moment calls for which tool.
Pingback: What Is Equity Research? Meaning, Purpose & How It Works