
What Is Stock Analysis? (Definition and Core Purpose)
At its simplest, the stock analysis definition describes a structured process investors use to study a company before deciding whether to buy its shares. It turns raw numbers into a clear picture of business health.
This process, often called equity analysis, looks beyond the stock price itself. It examines revenue, profitability, competitive position, and management decisions to understand what actually drives a company’s value over time for nearly every investor.
The main goal of evaluating stocks is reducing uncertainty. No investor can predict the future perfectly, but careful research narrows the range of outcomes and supports informed investment decisions grounded in evidence rather than guesswork.
Every analysis eventually leads to a practical outcome: a buy or sell decision. Investors weigh what a company is worth against what the market charges, a comparison rooted in stock valuation techniques using financial data.
Because thousands of publicly traded companies compete for investor attention, a disciplined investor research process helps separate genuinely strong businesses from those that merely look attractive on the surface without real substance standing behind them.
Why Stock Analysis Matters for Investors
Markets move on emotion as often as they move on facts, which is exactly why risk management depends on independent research. Analysis gives investors a factual anchor when prices swing sharply in either direction daily.
Careful research plays a direct role in avoiding overvalued stocks, where enthusiasm has pushed prices well beyond what the underlying business can realistically support given its earnings, growth rate, and competitive position within its industry.
The same process works in reverse. Finding undervalued stocks means spotting solid companies the market has temporarily overlooked, often because of short-term news rather than any real change in long-term prospects or underlying business fundamentals.
Consistent research habits support informed decision making over time, not just for a single trade. Investors who repeatedly evaluate their holdings tend to catch problems earlier and adjust before losses grow much larger over time.
Ultimately, the discipline serves two related goals: protecting capital during downturns and building long-term returns through patience. This distinction shapes the broader debate between active vs passive investing, including the index funds comparison beginners face.
Who Actually Needs to Do Stock Analysis?
Not every investor researches stocks the same way or for the same reason. Active investors who pick companies rely heavily on analysis, while day traders use a faster, chart-driven version focused on short-term price movement.
Long-term investors and dividend investors typically favor deeper fundamental research, since they care more about business durability and income stability than short-term price swings that dominate daily trading conversations and headlines across financial media today.
Meanwhile, passive index investors often skip individual stock analysis entirely, trusting diversification instead. This raises a practical question many beginners face: comparing DIY investors vs financial advisors when deciding who should do the necessary research.
The Main Types of Stock Analysis
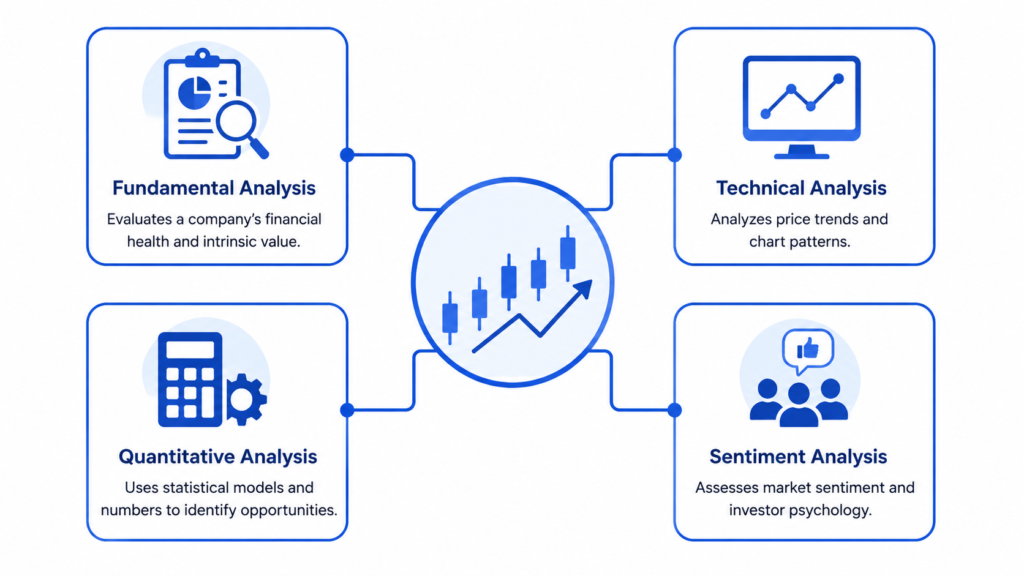
Investors generally rely on a handful of distinct approaches, each answering a different question about a company. Understanding the types of stock analysis available helps beginners choose methods that actually fit their personal goals well.
Fundamental analysis examines the underlying business itself, its earnings, debts, and competitive strengths, to estimate what a company is genuinely worth regardless of where its stock currently trades in the broader public stock market today.
Technical analysis takes a different route entirely. It studies price movement and trading patterns, assuming that historical charts can reveal clues about where a stock’s price may head next over the coming days and weeks.
Quantitative analysis relies on mathematical models and statistics rather than subjective judgment, screening large sets of stocks based on measurable factors like valuation ratios, growth rates, or volatility patterns across the broader stock market overall.
Beyond these three, sentiment analysis and qualitative analysis add further context. A useful analysis methods comparison shows these approaches are not competitors; skilled investors often blend several methods together for a much fuller overall picture.
Fundamental Analysis
Fundamental analysis starts with a company’s core financial statements: the income statement, balance sheet, and cash flow statement. Together these three documents reveal how money enters, moves through, and leaves the business each reporting period.
From this data, analysts attempt to estimate intrinsic value, meaning what a business is genuinely worth based on its earning power rather than its current market price, which can drift quite far from underlying reality.
This approach also weighs business fundamentals like revenue growth, profitability, and management quality, since numbers alone rarely tell the whole story without context about leadership decisions and competitive strategy measured against close industry rivals overall.
Technical Analysis
Technical analysis focuses almost entirely on price charts and trading volume, treating historical patterns as a window into likely future behavior rather than examining the company’s actual financial condition or overall business health and stability.
Common tools include moving averages, the RSI momentum indicator, and identifying support and resistance levels, all of which help traders visualize where buying or selling pressure might build up next within the broader market session.
Traders also study chart patterns and trend lines to time entries and exits more precisely. This makes technical work especially useful for market timing decisions rather than long-term valuation judgments about a company’s underlying worth.
Quantitative Analysis
Quantitative models turn investing into a data problem, applying statistical analysis across thousands of stocks simultaneously rather than researching companies one at a time the way traditional fundamental analysts typically operate each single trading day.
This method commonly uses algorithmic screening to filter stocks by measurable criteria, ranking companies automatically based on rules that would take a human analyst far longer to apply manually and consistently across an entire portfolio.
A closely related idea, factor investing, groups stocks by shared characteristics like value or momentum. Both approaches represent a broader shift toward data-driven stock selection across modern financial markets worldwide today, especially among institutional investors.
Sentiment and News Analysis
Market sentiment captures the collective mood of investors, whether optimistic or fearful, and can move prices even when a company’s underlying fundamentals have not changed meaningfully in either direction over the short term at all.
Tracking investor sentiment often involves news analysis, reviewing headlines, earnings calls, and public statements for language that signals confidence or concern about a company’s near-term outlook and direction in the weeks immediately ahead for shareholders.
Increasingly, analysts also monitor social media sentiment and analyst ratings as additional signals, recognizing that market psychology frequently drives short-term price action independent of a company’s actual financial performance in the short run each quarter.
Fundamental vs. Technical Analysis: Key Differences
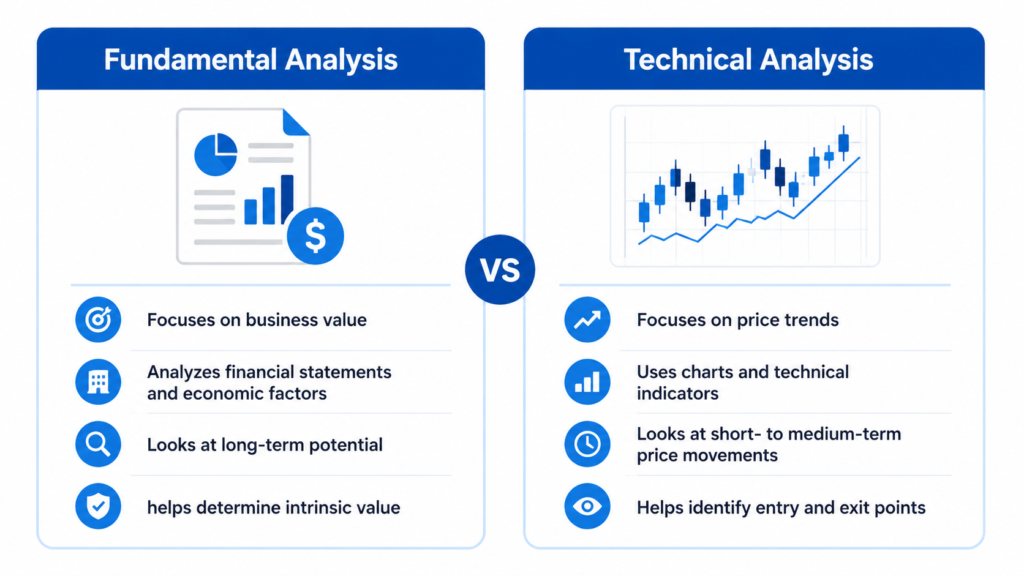
The core distinction in fundamental vs technical analysis comes down to purpose. Fundamental research asks whether a business is genuinely worth owning, while technical research asks when the price might move next in the market.
This also reflects a long-term vs short-term investing divide. Fundamental investors often hold positions for years, while technical traders may close positions within days, hours, or even minutes of opening them during a single session.
A simple way to remember the difference: fundamentals answer what to buy vs when to buy, which technical signals attempt to address. A quick comparison table often makes this distinction easier to quickly visualize overall.
Key Metrics and Ratios Used in Stock Analysis
Among the most widely referenced numbers is the P/E ratio, which compares a company’s share price to its earnings per share, often shortened to EPS, giving a quick sense of relative valuation against similar companies.
Return on equity, or ROE, measures how efficiently a company turns shareholder investment into profit. Higher figures generally suggest stronger management performance, though context and industry norms still matter significantly for accurate comparison purposes overall.
The debt-to-equity ratio reveals how much a company relies on borrowed money versus its own capital, a key signal for understanding financial risk during economic slowdowns or rising interest rate environments that affect borrowing costs.
Valuation-focused investors also examine the price-to-book ratio and dividend yield, which highlight how a stock’s price compares to accounting value and how much income it returns to shareholders annually relative to the current share price.
Finally, EV/EBITDA offers a broader valuation lens by accounting for debt alongside earnings. Together, these financial ratios for investors create a fuller picture than any single number could provide on its own without full context.
How to Perform Stock Analysis Step by Step
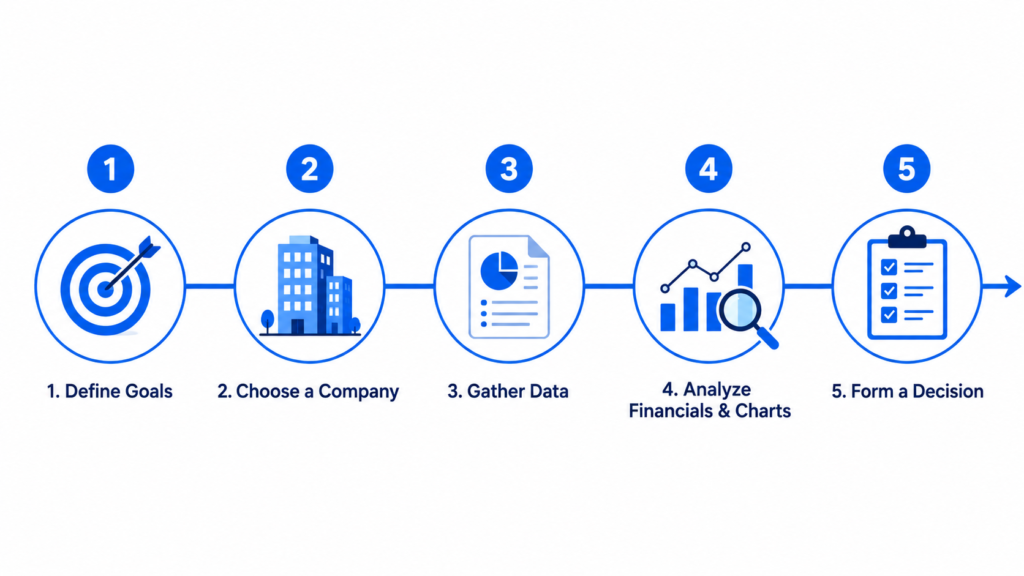
Learning how to analyze a stock becomes far easier with a repeatable framework. Rather than reacting to headlines, a structured stock research process keeps investors focused on facts instead of short-term market noise and speculation.
The overall stock analysis steps generally move from broad to specific, starting with personal goals and ending with a clear decision, ensuring nothing important gets skipped along the way throughout the entire evaluation process itself.
Evaluating a company thoroughly means combining several data sources rather than relying on a single number or headline, since no single metric fully captures a business’s complete financial picture, or its true overall investment potential.
Each stage builds toward forming an investment thesis, a concise explanation of why a stock deserves consideration, based on evidence gathered rather than speculation or borrowed opinions from other people encountered casually online or elsewhere.
The six steps that follow break this process into manageable, sequential actions any investor can practice repeatedly, gradually building confidence and consistency with each additional company they research over months and years of dedicated practice.
Step 1: Define Your Investment Goals and Time Horizon
Before opening a single chart, investors should clarify their investment goals. Saving for retirement decades away looks nothing like saving for a home down payment needed just a few very short years from right now.
Risk tolerance plays an equally important role here. Someone comfortable with large swings in value will approach research differently than someone who prioritizes stability and predictable, steady account growth year after year no matter what.
These two factors together define a person’s time horizon, shaping the broader short-term vs long-term investing decision that ultimately determines which analysis methods will prove most useful and relevant for that specific investor’s unique situation.
Step 2: Choose a Company or Sector to Research
With goals established, the next step involves narrowing focus. Many investors start with a stock screener, filtering thousands of companies down to a manageable shortlist based on chosen criteria like valuation, growth, or dividend yield.
Others prefer starting broader, conducting industry research first to understand which sectors show durable demand before drilling down into specific businesses operating within that space that appear best positioned for long-term sustainable growth and stability.
This stage of sector selection naturally leads into deeper company research, where an investor picks one or two candidates worth the significant time investment that thorough analysis requires to properly complete before moving forward confidently.
Step 3: Gather Financial and Market Data
Serious research relies on primary sources rather than secondhand summaries. 10-K filings provide the most detailed annual disclosure a company publishes, covering financials, risks, and management commentary in depth for shareholders and prospective investors alike.
Alongside these, annual reports offer a more readable overview, while SEC filings more broadly include quarterly updates and material event disclosures investors should monitor throughout the year to stay fully informed about ongoing company developments.
Earnings reports released each quarter update the picture between annual filings. Combining these various financial data sources builds a far more complete and current understanding of the business and its constantly evolving financial condition overall.
Step 4: Analyze Financial Statements and Ratios
With data collected, the real interpretation begins. Financial statement analysis involves comparing figures across several years to spot trends in growth, margins, and overall financial stability or deterioration that might otherwise go unnoticed by investors.
This stage also involves ratio analysis, calculating the metrics discussed earlier to benchmark the company against competitors and its own historical performance over multiple reporting periods to identify meaningful trends worth paying close attention to.
Investors typically separate this work into profitability metrics, which measure how efficiently a company earns money, and valuation metrics, which assess whether the current price reflects that earning power fairly given all currently available information.
Step 5: Review Price Charts and Market Trends
Even fundamentally focused investors benefit from a basic chart analysis step, since timing still matters when deciding exactly when to place a trade rather than simply which company to choose in the very first place.
Reviewing price trends over recent months can reveal whether a stock is in a clear uptrend, downtrend, or trading sideways, context that pure financial statements alone cannot fully provide no matter how detailed they are.
This step often informs a practical entry point and exit point, using simple technical indicators to avoid buying immediately before a sharp, temporary pullback in price, or selling too early before a strong upward move.
Step 6: Form an Investment Thesis and Decide
All prior research converges here. A clear investment thesis should summarize, in a few sentences, exactly why the stock fits the investor’s goals and what evidence supports that view based on everything learned during research.
This is also where the final buy sell hold decision gets made, weighed carefully against a broader risk assessment that considers what could go wrong and how severely it might affect the overall portfolio value.
Lastly, investors should consider portfolio fit, checking whether the position adds unwanted concentration or genuinely improves diversification alongside their other existing holdings and financial commitments already in place before finally finalizing any new trade decision.
Tools and Resources for Stock Analysis
Modern investors have access to far more resources than previous generations, ranging from simple stock screeners to comprehensive financial data platforms that aggregate years of company history in one place for quick and convenient reference.
Most brokerages now include built-in brokerage research tools, offering analyst reports, earnings estimates, and charting features directly within the trading account, reducing the need to jump between separate websites or juggle multiple browser tabs constantly.
Choosing between free vs paid stock analysis tools often depends on how deeply an investor plans to research. Casual investors may find free resources entirely sufficient for their needs without ever paying for anything extra.
For primary source documents, SEC EDGAR remains the definitive government database for official company filings, offering direct access to the same reports institutional analysts regularly rely upon themselves when conducting their own detailed research work.
Rounding out the toolkit, established financial news sources provide context around earnings surprises, industry shifts, and macroeconomic events that numbers alone cannot fully explain to individual investors trying to make sense of daily market moves.
Free Tools for Beginners
Numerous free stock analysis tools now rival paid platforms in basic functionality, offering charting, screening, and company summaries without any subscription cost attached to casual, exploratory research during the earliest stages of learning to invest.
Several free financial data websites compile historical statements, ratios, and news in one place, saving beginners from manually digging through lengthy filings during their earliest research sessions spent trying to understand how markets truly work.
These resources make excellent beginner-friendly platforms precisely because they simplify complex data into digestible summaries, letting new investors build research habits before committing to any paid subscription service down the road later as skills develop.
Professional and Paid Tools
As research needs grow more sophisticated, many investors eventually upgrade to paid stock research platforms offering deeper historical data, custom screening, and more advanced charting capabilities than free alternatives typically provide to casual, everyday users.
These professional analyst tools often include institutional-grade features like detailed peer comparisons, consensus estimates, and customizable alerts that casual investors rarely need during typical research sessions conducted somewhat occasionally for personal, non-professional investment purposes only.
Premium data subscriptions make the most sense for active investors managing larger portfolios, where the added cost is easily justified by time saved and deeper analytical capability gained throughout the entire investment decision-making process itself.
Common Mistakes and Limitations of Stock Analysis
Even disciplined investors run into stock analysis limitations, since no method can fully predict unpredictable events like sudden regulatory changes, natural disasters, or unexpected shifts in consumer behavior that no model could ever fully anticipate.
Among the most frequent common investing mistakes is treating analysis as a guarantee rather than a tool for improving the odds of a favorable outcome over time rather than an absolute promise of certain success.
Confirmation bias quietly undermines many research efforts, as investors unconsciously seek information supporting a view they already hold while dismissing evidence that might reasonably challenge that same conclusion, however uncomfortable it may feel to admit.
Another recurring issue involves overreliance on past data. Historical performance offers useful context, but it never guarantees similar results will repeat under different future market conditions and circumstances that no one can fully predict beforehand.
Finally, analysis paralysis and emotional investing can each derail otherwise sound research, reminding investors that market unpredictability means no process fully eliminates risk from investment decisions no matter how much careful preparation goes into them.
Stock Analysis vs. Related Concepts
Stock analysis often gets confused with neighboring disciplines that share overlapping tools but serve genuinely different purposes within the broader investment research process most investors eventually encounter while gradually learning how financial markets actually function.
Comparing stock analysis vs company valuation helps clarify this distinction. Valuation focuses narrowly on calculating a specific dollar figure, while analysis considers a much wider range of qualitative and quantitative factors relevant to the decision.
Similarly, stock analysis vs financial ratio analysis highlights scope differences. Ratio analysis is simply one tool within the broader analytical process rather than a complete standalone method by itself for fully evaluating any company thoroughly.
Looking beyond individual stocks, stock analysis vs portfolio management shows another layer of distinction, since portfolio management addresses how multiple holdings interact together rather than any single company alone in complete isolation from the rest.
Understanding these boundaries across related finance disciplines helps investors know exactly which skill or resource to reach for depending on the specific question they are currently trying to answer about a stock, sector, or portfolio.
Frequently Asked Questions
Is stock analysis necessary for beginner investors?
Not always. Beginner investors choosing passive index funds can skip deep research, though understanding basic stock analysis still builds valuable financial literacy useful for broader decisions, including the ongoing broader passive vs active investing debate.
What is the best type of stock analysis for long-term investing?
Most investors focused on long-term investing lean toward fundamental analysis, since it examines business durability and earning power rather than short-term price movement, aligning naturally with a patient buy and hold strategy over many years.
Can you do stock analysis without a finance background?
Yes. Someone with no finance background can still practice beginner-friendly stock analysis using free tools and plain-language resources, gradually learning financial concepts through consistent practice rather than requiring formal training beforehand in finance or investing.
How long does it take to analyze a stock?
The time to analyze a stock varies widely by depth. A quick stock analysis might take under an hour, while thorough in-depth stock research covering several years of filings can take considerably longer to complete.
What is the difference between stock analysis and stock valuation?
Comparing stock analysis vs valuation shows valuation is narrower in scope. It focuses on producing a fair value estimate using specific valuation methods, while analysis considers a broader mix of financial and qualitative factors together.
Do professional analysts use different methods than individual investors?
Professional analysts often rely on institutional research with access to management interviews and proprietary data, while individual investor methods typically depend more heavily on public filings and freely available research tools instead of online resources.
Can stock analysis guarantee investment success?
No method offers no guaranteed returns. Every position carries genuine investment risk, and market unpredictability means even thorough, well-researched analysis can still be followed by outcomes nobody could have reasonably foreseen in advance or expected.