
What Is Comparable Company Analysis?
Comparable company analysis is a relative valuation method. Analysts estimate a company’s worth by comparing it to similar publicly traded businesses. This approach relies on valuation multiples rather than long-term cash flow forecasts, making it a practical, market-driven tool.
The method rests on the law of one price. Similar businesses, facing similar risks and growth prospects, should trade at broadly similar valuation multiples. A sharp gap from its peer group valuation prompts investigation.
Unlike intrinsic vs relative valuation approaches, comps analysis skips detailed cash flow modeling. It asks a simpler question: what are similar companies worth today, per the market? This makes it a very accessible trading comps method.
Professionals across finance use this technique daily. Investment banking comps appear in pitch books, while equity research valuation method reports rely on it for price targets. Its speed and transparency explain why it remains a benchmark valuation staple.
At its core, comps analysis meaning boils down to disciplined comparison. Analysts gather public company comparables, calculate consistent multiples, then apply them to a target firm. The result is an implied valuation grounded in current market pricing, not theory.
Comparable Company Analysis vs. Other Valuation Methods
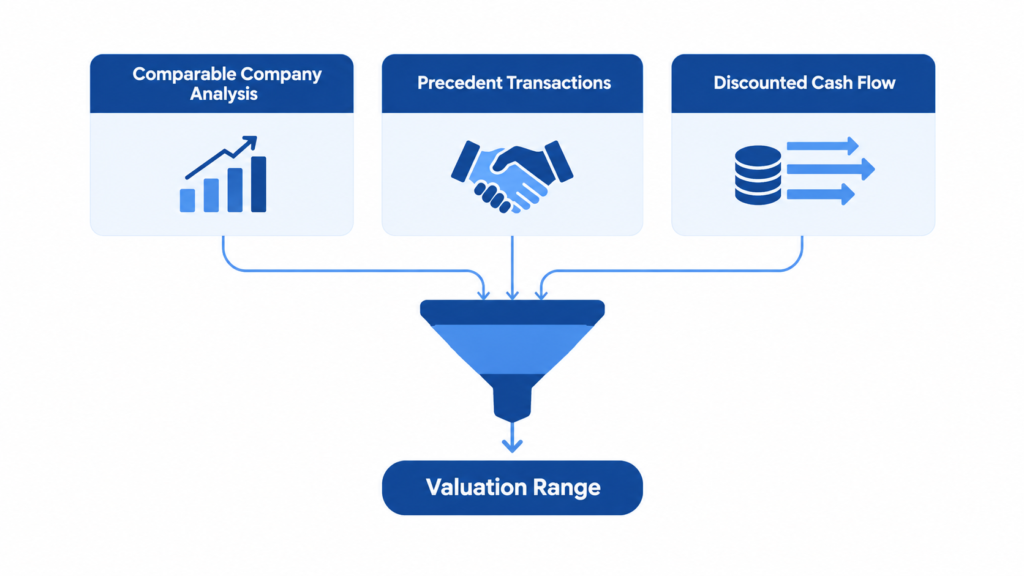
Valuation rarely relies on a single technique. Analysts typically triangulate between three core approaches: comparable company analysis, discounted cash flow modeling, and precedent transaction analysis. Each method answers a different question about a business’s worth.
CCA vs DCF highlights a fundamental split in philosophy. One method leans on market-based pricing, while the other builds value from projected cash flows. Understanding this distinction helps analysts decide which tool fits a given situation best.
Precedent transaction analysis vs comps raises a separate comparison. Transaction multiples reflect actual deals, often including a control premium, while trading comps reflect everyday public market pricing without that added premium baked in.
Many analysts build a football field valuation chart. This visual tool stacks value ranges from multiple methods side by side. It helps stakeholders see where valuation triangulation points toward a defensible, well-supported conclusion.
Choosing between methods depends on context and available data. When to use comps often comes down to needing a fast, market-grounded estimate. Cross-checking valuation methods remains standard practice across serious M&A valuation methods work.
Comparable Company Analysis vs. DCF Analysis
The intrinsic value vs relative value debate sits at the heart of this comparison. DCF analysis builds value from free cash flow projections, a discount rate, and a terminal value assumption. Comps skip these forward-looking estimates entirely.
Market sentiment vs fundamentals is another key contrast. DCF output depends heavily on internal DCF assumptions, which analysts control directly. Comps output instead depends on how the broader market is pricing similar businesses right now.
Many practitioners use comps as a reality check against DCF output. If a DCF analysis produces a value far outside the comps-based valuation range comparison, analysts revisit their assumptions before trusting either number.
Comparable Company Analysis vs. Precedent Transaction Analysis
Precedent transactions vs trading comps differ mainly through the lens of ownership. Transaction comps reflect what acquirers actually paid, including any control premium or synergy premium built into the final negotiated deal price.
Why precedent transactions trade higher comes down to control. Buyers pay extra to direct company strategy and capture synergies. Trading comps, by contrast, reflect minority public market pricing without any control rights attached.
This distinction matters for public vs private company valuation work. Acquisition multiples from real deals suit M&A contexts, while trading comps better represent day-to-day private market valuation benchmarking for ongoing business assessment purposes.
Why and When Comparable Company Analysis Is Used
The uses of comparable company analysis span nearly every corner of finance. Bankers use it for IPO valuation pricing, while corporate teams use it during M&A valuation discussions. Its flexibility explains its widespread adoption.
Within an investment banking pitch book, comps tables often anchor the entire valuation section. They give clients a defensible, market-grounded starting point. Bankers then layer other methods around this core sanity check valuation framework.
Equity research price target work depends heavily on comps too. Analysts compare a stock’s multiple to its sector benchmarking peers, helping investors judge whether a company looks stock over/undervalued relative to its industry group.
Private equity valuation teams also lean on this method. Sponsors use comps during portfolio company valuation reviews and when preparing a business sale valuation ahead of an exit, since buyers expect market-grounded pricing logic.
Beyond deals, comps support routine fundraising valuation conversations and fairness opinion reports. Its status as a quick valuation method makes it a natural first step before deeper, more time-intensive analysis begins.
Step 1: Selecting the Peer Group (Comparable Companies)
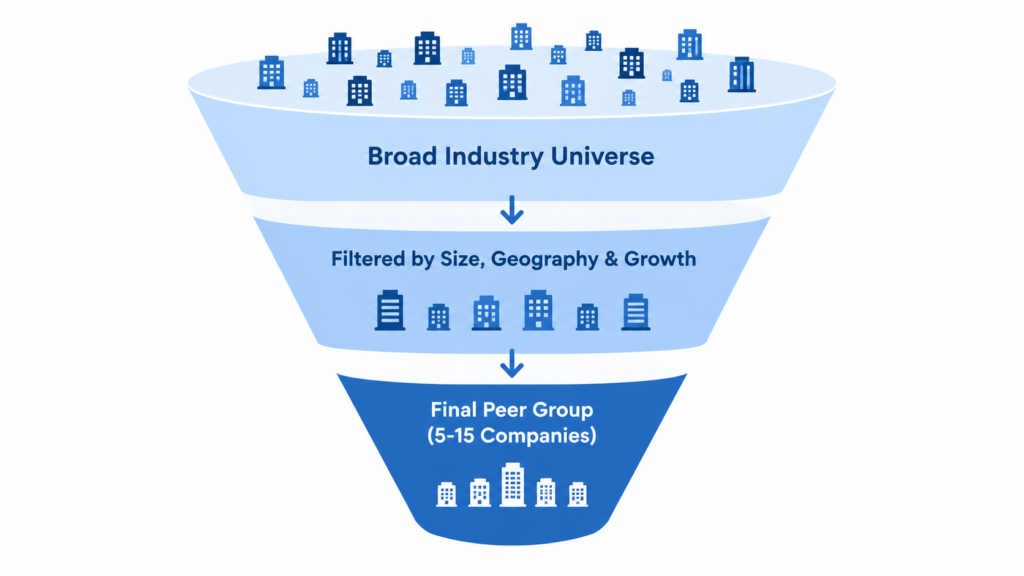
Building a strong comps universe starts with peer group selection. Analysts identify companies that share the target’s core business characteristics. This foundational step shapes every multiple and conclusion that follows in the analysis.
Comparable companies criteria typically begin with industry classification. Analysts often reference GICS/SIC industry codes to narrow the field. From there, they refine the list using more specific business model comparability judgments.
Company size comparison matters greatly during screening. A revenue and market cap screening filter helps ensure peers operate at a similar scale, since valuation multiples often shift meaningfully between small, mid-size, and large companies.
Geographic comparability and growth rate comparability round out the screening process. Companies operating in different regions or growth stages may deserve different multiples, even within the same broad industry or peer set construction exercise.
Peer selection always involves judgment calls. Subjectivity in peer selection means two analysts might build slightly different lists from the same starting universe. Documenting the reasoning behind each choice supports a more credible final analysis.
Key Criteria for Comparability
Industry and sector match forms the starting filter for any credible peer group. Beyond broad classification, analysts examine business mix closely, since companies in the same sector can still serve very different end markets.
Revenue size, profit margins, and capital structure comparability all shape how multiples behave. Two companies in the same industry can trade at different multiples if their financial profiles or leverage levels diverge significantly from one another.
Growth trajectory, geographic footprint, and cyclicality complete the picture. A high-growth company rarely compares well to a mature one. Matching these traits, alongside market capitalization range, produces a more defensible peer group overall.
How Many Comparable Companies to Include
There is no universal rule for the ideal number of comps, but most practitioners follow a loose 5 to 15 peers rule. This range balances statistical reliability with the practical difficulty of finding truly comparable businesses.
Too few comparables risk distorting the analysis, since a single unusual company can skew the entire sample size in finance. A thin sample leaves little room to identify or exclude a genuine outlier peer’s situation.
Too many comparables dilution creates a different problem. Stretching the peer group too wide, just to hit a target count, pulls in less relevant businesses. This produces a less reliable, less focused comps table size.
Where to Find Comparable Companies (With and Without a Terminal)
Professional analysts often rely on a Bloomberg terminal alternative or a CapIQ alternative when institutional access isn’t available. These platforms aggregate financial data, industry classifications, and stock screener tools into one convenient workspace.
Individual researchers can still build solid comps without expensive subscriptions. SEC EDGAR comparable companies research allows direct access to company filings research, including annual and quarterly reports filed by publicly traded businesses.
Free stock screener tools and competitor analysis for comps research round out the process. Combining regulatory filings with free financial data sources lets analysts build a credible peer group finding public peers without Bloomberg subscriptions.
Step 2: Gathering Financial Data
Once the peer group is set, financial data collection for comps begins. Analysts pull figures from 10-K and 10-Q data, focusing on both historical results and the most recent quarterly filings available for each peer.
Income statement figures provide the profitability inputs analysts need. Revenue, operating income, and net income all matter here. These figures feed directly into the multiples calculated later in the comps table walkthrough process.
Balance sheet data supplies the capital structure picture. Analysts note cash and equivalents, total debt, and other items needed for net debt calculation, which becomes essential when computing enterprise value later in the process.
Market capitalization, shares outstanding, and current share price data come from live trading information. These figures combine with net debt calculation results to produce the enterprise value inputs required for multiple calculations.
Analysts also gather analyst consensus estimates for forward-looking metrics. Alongside trailing twelve months TTM figures, these forward estimates allow comparison across both historical and projected performance, giving a fuller picture of each peer.
Step 3: Calculating Key Valuation Multiples
With data collected, analysts move to valuation multiples explained in practical terms. Multiples divide a value measure by a financial metric, creating a standardized way to compare companies of very different sizes.
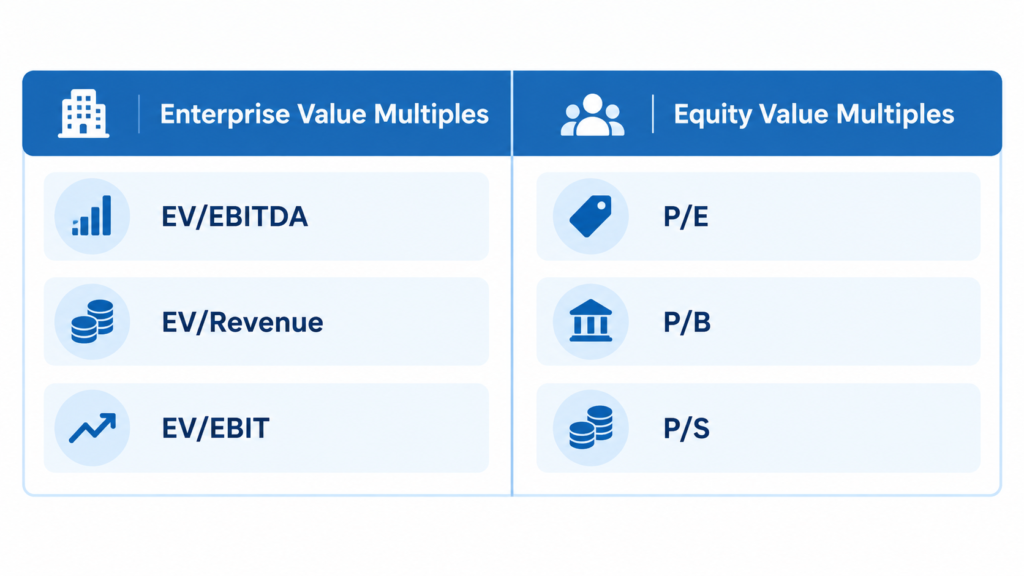
Numerator denominator consistency is a critical rule here. Enterprise value vs equity value multiples must be paired correctly. Enterprise value pairs with pre-interest metrics, while equity value pairs with metrics after interest expense.
Capital structure neutral multiples, like EV/EBITDA multiple, ignore financing choices entirely. This makes them useful when comparing companies with different debt levels, since leverage differences would otherwise distort a simpler equity-based comparison.
Analysts also distinguish between trailing multiples and forward multiples. Trailing figures use historical results, while forward figures rely on projected performance. Both offer useful, complementary perspectives within a complete comps analysis.
Industry-specific multiples apply in certain sectors too. Which multiple to use ultimately depends on the industry, profitability profile, and data availability for the specific peer group being analyzed in any given project.
EV/EBITDA
The EV/EBITDA formula divides enterprise value by earnings before interest, taxes, depreciation, and amortization. This EBITDA definition strips out financing and accounting choices, leaving a cleaner measure of core operating performance.
Why EV/EBITDA is preferred comes down to comparability. Because it is capital structure neutral, this unlevered multiple works well across companies with different debt levels, making it the most common valuation multiple in professional practice.
Analysts favor EV/EBITDA partly because EBITDA stays positive more often than net income. This makes the multiple usable across a wider range of companies, including those carrying meaningful debt or facing near-term profitability pressure.
Price-to-Earnings (P/E)
The P/E ratio formula divides share price by earnings per share, or equity value by total net income. As an equity value multiple, it reflects returns available specifically to shareholders after all other obligations.
Because P/E is a net income multiple, it captures the effects of financing decisions. Leverage distortion can make two operationally similar companies show very different P/E ratios, simply due to differing debt levels.
P/E limitations extend beyond leverage sensitivity. The ratio breaks down entirely for unprofitable companies. Analysts also weigh trailing vs forward P/E carefully, since near-term earnings swings can distort either measure significantly.
EV/Revenue and EV/Sales
The EV/Revenue formula divides enterprise value by total revenue. Analysts turn to this measure when revenue multiples become necessary, particularly for companies that haven’t yet reached consistent profitability.
Unprofitable company valuation work often relies on revenue-based multiples. Without positive earnings or EBITDA, profitability multiples simply don’t apply. Revenue offers a usable, always-positive denominator instead for these early-stage company multiples.
Still, revenue multiple limitations deserve attention. Revenue ignores cost structure entirely, so two companies with identical sales but different margins can look similarly valued despite very different underlying high-growth company valuation profiles.
Other and Industry-Specific Multiples
Beyond the core multiples, analysts sometimes use price to book ratio, especially for asset-heavy or financial businesses. EV/EBIT offers another variation, factoring depreciation and amortization back into the profitability measure used.
Sector-specific multiples appear throughout specialized industries. SaaS valuation multiples often reference recurring revenue, while real estate valuation multiples (P/FFO) replace earnings with funds from operations, a more relevant measure for property companies.
Bank valuation multiples and other industry-specific KPIs round out the specialized toolkit. These non-standard multiples exist because traditional earnings or EBITDA measures sometimes fail to capture what truly drives value in that sector.
Step 4: Benchmarking the Peer Group
Once multiples are calculated for every peer, benchmarking comparable companies begins in earnest. Analysts organize the data into a structured table, then look for patterns, ranges, and meaningful statistical tendencies within the group.
A typical comps table statistics summary includes high low median multiples for the group. This multiple range analysis gives readers a quick sense of where the peer group clusters, and how wide the overall range is.
Quartile analysis can add further precision to this picture. Instead of a single midpoint, quartiles show how multiples distribute across the full peer set, helping analysts spot valuation range construction patterns more clearly.
Before finalizing any range, analysts address outlier exclusion. Trimming outliers prevents a single unusual company from skewing the group’s central tendency, ensuring the final apples to apples comparison remains genuinely representative and useful.
This benchmarking step transforms raw multiples into a usable valuation tool. It bridges the gap between individual company data and a coherent, defensible range that analysts can later apply to a specific target.
Median vs. Mean: Which to Use
The median vs average valuation question comes up constantly in comps work. Because financial data often skews, outlier sensitivity makes the mean less reliable than the median for most central tendency in finance purposes.
Statistical measures in finance each carry tradeoffs. The mean uses every data point but reacts strongly to extremes. The median ignores magnitude entirely, offering a more robust valuation benchmark when a peer group contains outliers.
Most practitioners default to the median for headline figures. Still, reviewing both measures helps analysts understand skewed data handling within their specific peer group, especially when the two statistics diverge meaningfully from each other.
Normalizing and Adjusting Financials
Non-recurring items must be removed before multiples become truly comparable. One-time gains and losses, along with restructuring charges adjustment, can distort reported earnings in ways unrelated to ongoing business performance.
Accounting policy differences between companies also require attention. Two peers might report similar performance differently, simply due to varying accounting choices. Adjusting for these differences supports a genuinely apples-to-apples financial comparison.
Analysts frequently compute adjusted EBITDA as part of this process, applying pro forma adjustments where appropriate. This careful normalization in valuation work ensures the resulting multiples reflect true underlying operating performance.
Step 5: Applying the Multiples to Value the Target Company
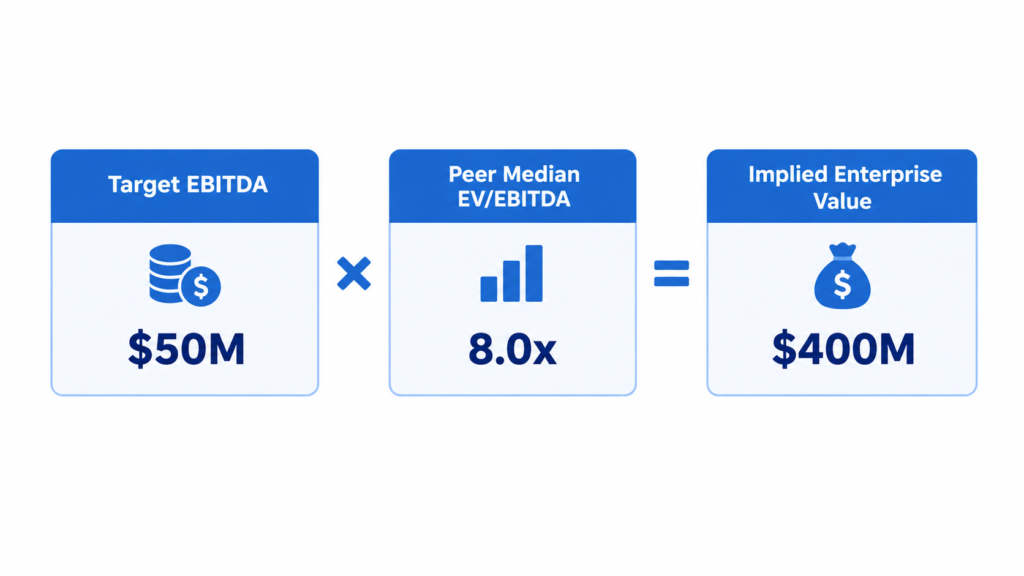
With a benchmarked range in hand, analysts move toward applying valuation multiples to the target company. This step translates peer group statistics into a concrete, company-specific valuation output that stakeholders can actually use.
The multiple times metric formula works simply in concept. Analysts multiply the chosen benchmark multiple by the target’s own financial metric, producing either an implied enterprise value or an implied equity value figure.
Moving between these two values requires the EV to be an equity value bridge. Analysts subtract net debt from enterprise value to reach equity value, then divide by share count for a per share value calculation.
A thorough analysis rarely stops at one number. Sensitivity analysis valuation work applies the full valuation range low high median spread, producing a range rather than a single misleadingly precise target company valuation figure.
Interpreting this valuation output interpretation correctly matters as much as calculating it. The resulting range represents one data point among several, meant to inform discussion rather than dictate a definitive final answer.
Full Worked Example with a Sample Comps Table
Consider a hypothetical comps table example built from five similar public companies. Below is a simplified sample peer group table, showing EV/EBITDA multiples derived from each peer’s enterprise value and reported EBITDA figure.
| Company | Enterprise Value | EBITDA | EV/EBITDA |
| Peer A | $1,200M | $150M | 8.0x |
| Peer B | $950M | $110M | 8.6x |
| Peer C | $2,100M | $240M | 8.8x |
| Peer D | $780M | $95M | 8.2x |
| Peer E | $1,450M | $175M | 8.3x |
This five company comps table produces a median multiple around 8.3x. Following this step by step valuation example, analysts would apply that median to the target company’s own EBITDA figure to estimate value.
Suppose the target company reports EBITDA of $130M. Multiplying by the 8.3x median produces an EBITDA multiple example calculation near $1,079M. This implied valuation walkthrough illustrates how a real numbers comps example functions in practice.
Advantages of Comparable Company Analysis
Among the clearest benefits of comps valuation is speed. Compared to building a detailed cash flow model, gathering peer multiples and applying them takes far less time, making it a genuinely quick valuation method.
Market-based valuation advantages stem from using live, observable pricing. Rather than relying on internal projections, comps reflect current market sentiment reflection, grounding the analysis in how investors are actually pricing similar businesses today.
Minimal assumptions required sets comps apart from forecast-heavy methods. Analysts avoid making detailed predictions about future growth or margins, which reduces the risk of compounding small forecasting errors into a distorted final valuation.
The method also offers ease of use and easy to explain valuation logic. Clients and stakeholders generally grasp comps intuitively, since comparing a company to its peers matches how people naturally reason about relative worth.
Cross-industry flexibility and transparency in valuation round out its strengths. Because the underlying logic stays consistent across sectors, comps serve as a practical, standardized approach that supports less forecasting required analysis broadly.
Limitations and Common Pitfalls of Comparable Company Analysis
Despite its usefulness, limitations of comps valuation deserve serious attention. Because the method depends entirely on market pricing, it inherits every flaw present in that market, including temporary mispricing or irrational investor sentiment.
Market mispricing risk sits at the center of these concerns. If the broader market overvalues an entire sector, comps will simply replicate that overvaluation rather than revealing it, creating a bubble valuation risk for analysts.
The dot-com bubble example illustrates this danger clearly. Internet companies traded at extreme multiples during that period. Comps built from those peers would have produced dangerously inflated, unreliable valuation conclusions for any target company.
No true comparables problem affects unique or highly specialized businesses. A small or thin peer group limits statistical reliability, while cyclical industry distortion can skew multiples depending on where the industry sits in its cycle.
Additional concerns include control premium omitted from trading comps and illiquid stock distortion among thinly traded peers. Over-reliance on market sentiment, without cross-checking other methods, remains one of the most common comps valuation mistakes.
When Comps Break Down (Negative Earnings, No Clean Peers, Market Bubbles)
Negative EBITDA companies pose an immediate challenge, since standard multiples become meaningless without a positive denominator. Analysts often pivot toward revenue-based measures instead, though these carry their own revenue multiple limitations as discussed earlier.
No public comparables available situations arise for truly unique businesses or emerging industries. In these cases, analysts sometimes rely on unlisted comparable substitutes or loosen their criteria carefully, while acknowledging the reduced reliability involved.
Distressed company valuation and thin trading volume create further complications. A private company comps challenge also emerges when illiquidity and limited disclosure make finding truly comparable public peers difficult, regardless of industry classification efforts.
Common Mistakes to Avoid
Mismatched peer group selection ranks among the most frequent comps analysis mistakes. Choosing companies from adjacent but distinct industries, simply to hit a target sample size, undermines the entire analysis from the start.
Ignoring capital structure differences creates another common error. Analysts sometimes compare equity multiples without accounting for leverage variation, producing a failure to normalize financials that distorts the final conclusions significantly.
Mixing trailing and forward data within the same table causes confusion too. Combined with too small sample size issues and over-reliance on one multiple, these mistakes compound quickly using stale market data inputs.
How Comparable Company Analysis Is Used in Practice (By Role)
Comps in investment banking typically appear inside pitch books and fairness opinions. Junior bankers build and update these tables constantly, since they form a core part of nearly every advisory engagement across the firm.
Comps in equity research serve a slightly different purpose. Analysts use them to justify comps for stock recommendations, comparing a covered company’s multiple to its sector peers as part of a broader research report.
Comps in private equity support both entry and exit decisions. Sponsors reference comps in corporate development work when evaluating acquisition targets, and again later when preparing a portfolio company for eventual sale.
Within comps in M&A pitch books, the analysis often sits alongside DCF and precedent transaction output. Comps in fairness opinions require particular rigor, since these documents carry legal weight in transaction approval processes.
Beyond deal-making, comps in IPO pricing help set initial offering ranges. Comps for startups and comps for business valuation reports extend the method into earlier-stage and non-public contexts, despite the added comparability challenges involved.
Frequently Asked Questions
What is comparable company analysis in simple terms?
In a beginner definition, it means valuing a company by comparing it to similar public businesses. This relative valuation basics approach uses peer comparison valuation multiples rather than detailed internal financial projections or forecasts.
What is the difference between comparable company analysis and comparable transaction analysis?
Trading comps vs transaction comps centers on ownership context. Trading comps reflect public market pricing, while transaction comps include a control premium difference from actual M&A comps distinction deal premiums paid.
What multiples are most commonly used in comparable company analysis?
Most common valuation multiples include EV/EBITDA and P/E ratio. EV/EBITDA popularity stems from its capital structure neutrality, while P/E ratio usage remains widespread among equity-focused, industry standard multiples applications broadly.
How many comparable companies should you include in a comps analysis?
Most analysts aim for an ideal peer group size between five and fifteen companies. This range balances minimum comparable companies reliability against practical limits, following a general sample size guideline for credible results.
Why is EV/EBITDA preferred over P/E in comparable company analysis?
EV/EBITDA vs PE ratio comparisons favor EBITDA-based multiples due to capital structure neutrality. Since leverage distortion in PE can mislead comparisons, this unlevered multiple advantage explains why analysts often prefer it.
Can comparable company analysis be used for private companies?
Yes, though private company valuation with comps requires adjustments. Analysts often apply an illiquidity discount to account for the no public comparables solution challenge, since private shares lack active public trading markets.
What are the main weaknesses of comparable company analysis?
Key comps valuation drawbacks include market mispricing risk and limited comparability issue concerns. The control premium omission and broader cyclicality distortion effects also limit how reliably the method reflects true value.
Is comparable company analysis a form of relative valuation or intrinsic valuation?
It falls under relative valuation classification, not the intrinsic value distinction. As a market-based valuation category, this valuation methodology classification contrasts directly with cash-flow-driven approaches like discounted cash flow analysis.
How do you find comparable companies without a Bloomberg or CapIQ subscription?
Free comps data sources include SEC EDGAR peer research and various free stock screener tools. These no-terminal valuation research options provide low-cost comps alternatives for analysts without institutional data access.
What is the difference between trailing and forward multiples?
Trailing twelve months multiple figures use historical results, while a forward multiple definition relies on projections. This LTM vs NTM valuation distinction shapes which multiple periods to use for a given analysis.
Pingback: Business Valuation Explained: Methods, Meaning & Uses
Pingback: What Is Equity Research? Meaning, Purpose & How It Works