
What Valuation Means in Equity Research
Equity research valuation is the analytical process analysts use to estimate what a company is genuinely worth today, separate from wherever its stock currently happens to trade in public markets. It answers one central question.
Analysts weigh fair value against intrinsic value, two closely related ideas, then compare both figures to the current market price vs intrinsic value gap, deciding whether shares appear overvalued or undervalued relative to underlying fundamentals.
Sell-side research teams publish valuation work for brokerage clients and the wider investing public, while buy-side research stays private, guiding portfolio decisions inside asset management firms, hedge funds, and large public pension funds quite directly.
Every finished report centers on a price target, the analyst’s forecasted future share price, paired with a buy hold sell rating that turns detailed valuation work into one clear, actionable investment recommendation for busy readers.
Treating valuation as a process rather than a single fixed calculation explains why research report structure matters, why analyst coverage continues for years, and why fundamental analysis ultimately anchors every conclusion an analyst finally reaches.
The Core Valuation Approaches Used in Equity Research
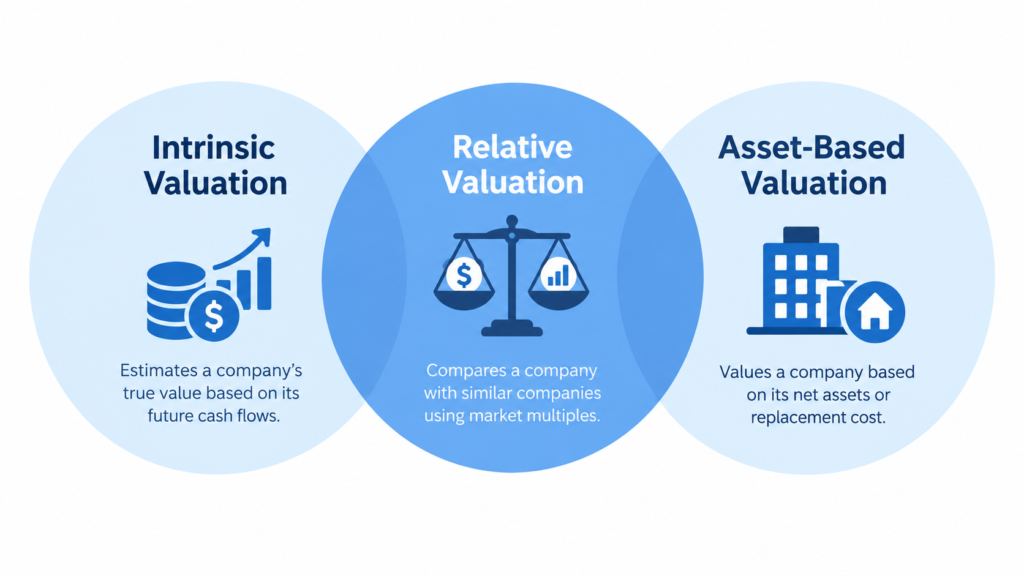
Analysts generally choose between intrinsic valuation and relative valuation, two distinct philosophies for estimating worth. Intrinsic methods build value from a company’s own fundamentals; relative methods lean instead on how comparable peer companies are priced.
A third lens, market-based valuation, studies what real buyers actually pay in observed transactions, while asset-based valuation starts instead from the balance sheet, tallying tangible and intangible resources a company genuinely owns and directly controls.
The income approach projects future cash flows and discounts them back to today’s dollars, whereas the market approach compares a company directly against similar businesses already priced by investors across both public and private markets.
Understanding absolute valuation vs relative valuation clarifies this broader valuation framework: absolute methods largely ignore market sentiment, while relative methods assume the wider stock market has already priced comparable peer businesses fairly and reasonably well.
Because no single method captures everything, analysts practice triangulation, applying multiple valuation methods side by side. This valuation approach comparison shapes valuation approach selection, forming a practical valuation methodology overview any analyst can readily apply.
Intrinsic Valuation (Discounted Cash Flow)
DCF valuation, short for discounted cash flow, remains the most widely used intrinsic valuation method in equity research today, since it estimates worth from a company’s own expected future cash generation, not comparable market prices.
The core DCF formula discounts a projected free cash flow forecast back to its present value of cash flows, reflecting the simple idea that money received later is always worth less than money received today.
Because it relies on detailed cash flow projection work rather than external market comparisons, DCF in equity research is often treated as the purest form of fundamentals-based valuation technique analysts apply across almost any company.
Relative Valuation (Comparable Company Analysis)
Comparable company analysis, often shortened to trading comps, values a business by studying how similar public companies are currently priced relative to their own reported financial metrics, then applying that exact same pricing logic elsewhere.
This method relies heavily on peer group multiples like the P/E ratio and EV/EBITDA multiple, both drawn from actively traded public stocks, making it a genuinely practical, useful form of market-based valuation grounded in sentiment.
Analysts running comps analysis depend on careful peer benchmarking, since sloppy peer selection quietly undermines the entire output. This multiple valuation approach usually performs best when comparable companies truly and closely resemble the target business.
Precedent Transaction Analysis
Precedent transactions, also called transaction comps, examine prices actually paid in past mergers and acquisitions involving genuinely similar companies, offering analysts yet another meaningful data point beyond ordinary daily public market trading levels seen elsewhere.
These M&A valuation multiples typically run higher than standard trading comps, because acquirers must pay a control premium for full ownership, a factor analysts carefully adjust for when comparing individual deal comps directly and fairly.
A thorough historical transaction analysis requires disciplined precedent deal screening to isolate genuinely relevant acquisition multiples. This transaction-based valuation method appears more often in banking work than in typical precedent transactions in equity research coverage.
Asset-Based Valuation
Asset-based valuation estimates a company’s worth by summing its underlying resources, calculating a net asset value instead of projecting future earnings or cash flow, an approach particularly well suited to certain capital-heavy industries over others.
NAV valuation starts from reported book value on the balance sheet, then adjusts individual assets and liabilities toward realistic current market figures, sometimes estimating liquidation value for companies facing genuine financial distress today or restructuring.
This tangible asset valuation technique, also known as the asset approach, produces a useful net asset value per share figure, especially relevant for asset-heavy company valuation across real estate, banking, and natural resource sectors today.
Dividend Discount Model (DDM)
The dividend discount model values a stock purely from its expected future payouts to shareholders, making DDM valuation most relevant for mature, cash-generative companies with long, predictable dividend histories and consistently stable, well-established payout policies.
A common variant, the Gordon growth model, assumes dividends grow at one constant rate forever, simplifying dividend valuation into a single formula built around the present value of dividends an investor expects to eventually receive.
Because the DDM formula depends heavily on payout consistency, it suits stable dividend companies far better than younger growth stocks. Comparing DDM vs DCF usually comes down to how reliable the dividend growth rate looks.
How to Build a DCF Valuation for Equity Research (Step-by-Step)
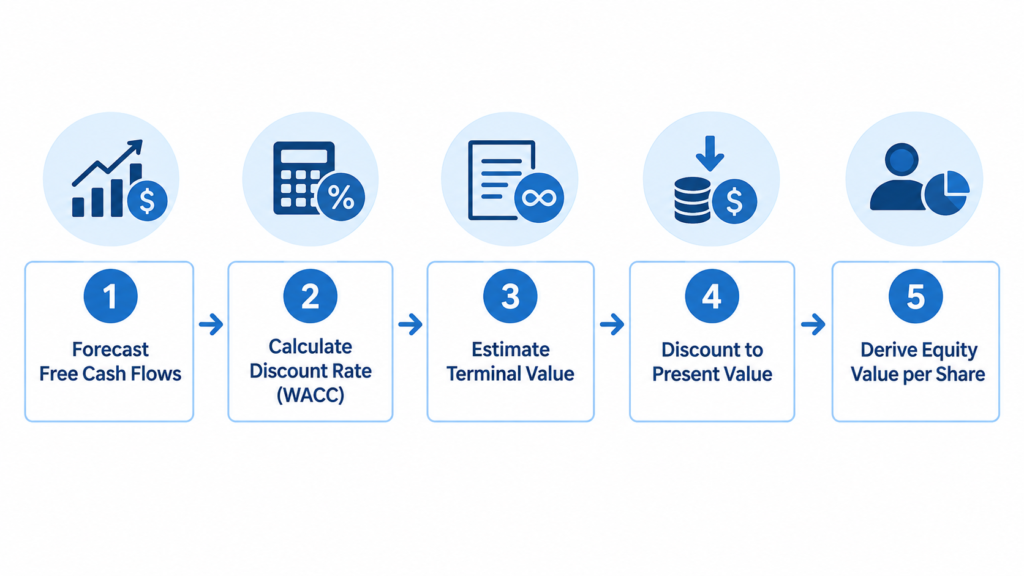
Building a reliable DCF model follows a defined sequence of DCF model steps, starting with historical financial review and ending with a final equity value figure ready for comparison against the company’s current market price.
The process begins with a detailed free cash flow forecast, projecting revenue, margins, and reinvestment needs across a chosen forecast horizon, before shifting close attention toward the rate used to discount those projected cash flows.
That rate, produced by the WACC calculation, blends the cost of debt and cost of equity into a single discount rate, reflecting how genuinely risky the underlying business appears to outside investors weighing its capital.
Beyond the explicit forecast window, analysts estimate terminal value using either the Gordon growth terminal value method or the exit multiple terminal value approach, then finish the full present value calculation for every projected year.
Finally, running a DCF sensitivity analysis across assumptions, forecast period lengths, and unlevered free cash flow estimates helps analysts stress-test their full DCF model example, refining core DCF assumptions before finishing any DCF valuation walkthrough.
Forecasting Free Cash Flow
An accurate free cash flow forecast starts with realistic revenue growth assumptions, grounded in historical performance, industry trends, and competitive positioning, rather than optimism entirely detached from a company’s actual documented operating history and results.
From there, analysts build an EBITDA margin forecast, followed by a capex forecast reflecting expected reinvestment needs, since both figures directly shape how much genuine free cash a business generates each year for its shareholders.
Adjusting for working capital changes completes the FCF calculation, while choosing an appropriate forecast period length ensures the model captures enough genuine underlying cash flow drivers to reflect the whole business realistically over the years.
Calculating the Discount Rate (WACC)
The WACC formula combines a company’s cost of debt and cost of equity, weighted by their respective shares of total capital, producing the single weighted average cost of capital figure used throughout the DCF model.
Estimating the cost of equity typically relies on CAPM, which factors in a company’s beta, a measure of stock volatility relative to the broader market, alongside prevailing broader market return expectations demanded by equity investors.
The cost of debt reflects a company’s own borrowing rate, adjusted for tax benefits, while the risk-free rate anchors the whole calculation. Combined, these discount rate assumptions together shape how conservative any final valuation becomes.
Estimating Terminal Value
Terminal value often represents the majority of a DCF’s total worth, since it captures every cash flow beyond the explicit forecast period, making its estimation one of the most sensitive steps in the entire model.
The Gordon growth method assumes cash flows grow at one constant, stable rate forever, while the exit multiple method applies a market-based multiple to a final year metric, offering analysts a useful, practical cross-check tool.
Choosing a realistic perpetuity growth rate matters enormously, since small changes can swing final results dramatically. This terminal value formula sensitivity means analysts should always run a terminal value comparison and terminal value sensitivity check.
Common DCF Mistakes to Avoid
Among the most frequent DCF mistakes are unrealistic growth assumptions that extend unusually high growth rates far beyond what any mature company could plausibly sustain over a long multi-year forecast period without clear, solid justification.
Terminal value overweighting occurs when analysts lean too heavily on distant, uncertain assumptions, while WACC errors from mismatched risk assumptions can quietly distort an entire company valuation without any analyst even noticing the underlying problem.
Circular reference errors in spreadsheet models and overly optimistic forecasts rank among the most common DCF pitfalls analysts regularly encounter, which is why sensitivity analysis importance simply cannot be overstated when finalizing any valuation conclusion.
How to Run a Comparable Company Analysis
Running a sound comps analysis steps process begins with careful peer group selection, followed by gathering trading multiples for each chosen company, then normalizing that data carefully for meaningful comparison across the entire selected group.
Common multiples include the P/E ratio, EV/EBITDA, and EV/Sales, alongside the P/B ratio for asset-heavy businesses and the PEG ratio for growth companies, where growth meaningfully affects overall valuation conclusions reached by most careful analysts.
Selecting comparable companies requires careful judgment beyond simple industry codes, since multiple adjustments often prove genuinely necessary to account for real differences in size, leverage, or profitability among otherwise similar businesses across a given sector.
Once multiples are gathered, analysts calculate a comps valuation range by applying peer multiples directly to the target company’s own financials, using consistent screening criteria for comps applied evenly and fairly throughout the entire exercise.
This industry peer benchmarking forms the backbone of the broader relative valuation process, though analysts must always stay alert to common comps analysis mistakes like stale historical data or genuinely mismatched underlying business models today.
Selecting the Right Peer Group
Strong peer group selection criteria start with accurate industry classification, ensuring candidate companies actually compete in the exact same markets, serve similar customers, and face closely comparable regulatory, competitive, or economic pressures across their operations.
Beyond industry alone, analysts also weigh company size comparability and growth rate comparability, since a small, fast-growing company rarely trades at the same multiples as a large, mature competitor operating within the same broader sector.
Thorough comparable companies screening also carefully considers geographic comparability and business model similarity, refining the final peer set construction until it genuinely reflects the target company’s true operating conditions and its overall competitive market position.
Choosing the Right Valuation Multiples
Different multiples suit different situations: the P/E ratio works well for profitable, stable companies, while EV/EBITDA and EV/Sales often serve much better for capital-intensive or early-stage businesses that lack consistent, predictable annual reported earnings figures.
The P/B ratio remains especially useful for banks and other asset-heavy firms, while the PEG ratio helps compare companies growing at meaningfully different rates by factoring expected growth directly into the resulting valuation multiple itself.
Deciding which multiple to use ultimately depends on prevailing industry norms, since multiple selection by industry varies quite widely across sectors. A careful valuation multiple comparison across several metrics reduces reliance on any single figure.
Sector-Specific Valuation Methods Analysts Actually Use
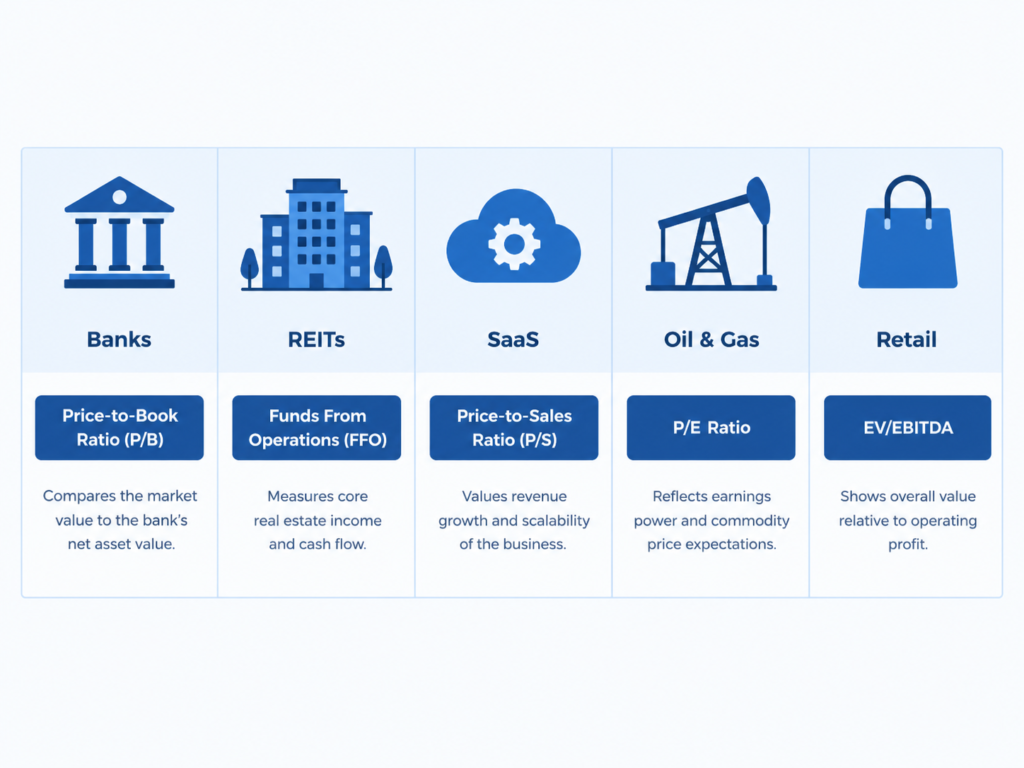
Standard tools like DCF and comps rarely apply cleanly everywhere, which is exactly why sector-specific valuation methods exist, adapting core valuation logic to the genuinely unique economics of particular industries and diverse business models today.
Bank valuation P/B ROE frameworks replace typical cash flow models almost entirely, since banks operate quite differently from other companies, while REIT valuation NAV FFO approaches reflect real estate’s genuinely unique income and asset characteristics.
SaaS valuation revenue multiple methods address the reality that many growth companies remain unprofitable for years, just as insurance company valuation and oil and gas valuation NAV address deeply industry-specific accounting and financial reporting realities.
Beyond these examples, retail valuation and tech company valuation each rely heavily on their own industry-specific multiples, illustrating clearly how valuation by sector consistently outperforms simple one-size-fits-all approaches across many genuinely diverse business types today.
This need for financial institution valuation adjustments and growth company valuation methods explains why analysts develop and refine non-standard valuation metrics, applying thoughtful sector adjustments in equity research through carefully built, fully custom valuation frameworks.
Valuing Banks and Financial Institutions (P/B, ROE)
Bank valuation typically centers on the price to book ratio rather than cash flow multiples, since a bank’s own balance sheet, not its reported operating cash flow, best represents its true core underlying earning capacity.
Analysts pair this ratio with return on equity, since profitable banks earning strong returns on their own equity base typically justify higher price to book ratio multiples than weaker competitors operating across that same sector.
This approach to financial institution valuation relies heavily on accurate, up-to-date book value per share figures, making bank-specific multiples truly essential, reliable tools wherever standard cash flow models simply do not apply so well today.
Valuing REITs (NAV, FFO, AFFO)
REIT valuation typically starts with net asset value, estimating what a real estate portfolio would fetch if sold entirely today, since traditional accounting earnings figures poorly reflect real estate’s true underlying economic value and performance.
Because depreciation distorts reported earnings for property owners, analysts instead rely on funds from operations, and often refine that number further into adjusted funds from operations for a much cleaner, more accurate cash flow picture.
This real estate investment trust valuation approach frequently applies an FFO multiple instead of a standard earnings multiple, reflecting how quite differently these real estate property companies generate, recognize, and ultimately report their annual income.
Valuing High-Growth and SaaS Companies (Revenue Multiples)
SaaS valuation commonly relies on a revenue multiple rather than earnings, since many software companies intentionally reinvest available profits into growth, leaving very little reported net income for traditional earnings-based valuation methods to meaningfully capture.
The EV to revenue multiple works particularly well for this common unprofitable company valuation challenge, comparing enterprise value directly against total sales rather than a positive bottom line that may simply not yet fully exist.
Analysts applying growth company valuation logic often use a forward revenue multiple instead, projecting next year’s expected sales rather than historical figures, since rapid ongoing growth quickly outdates most trailing historical financial data available today.
Combining Methods to Set a Target Price (Triangulation)
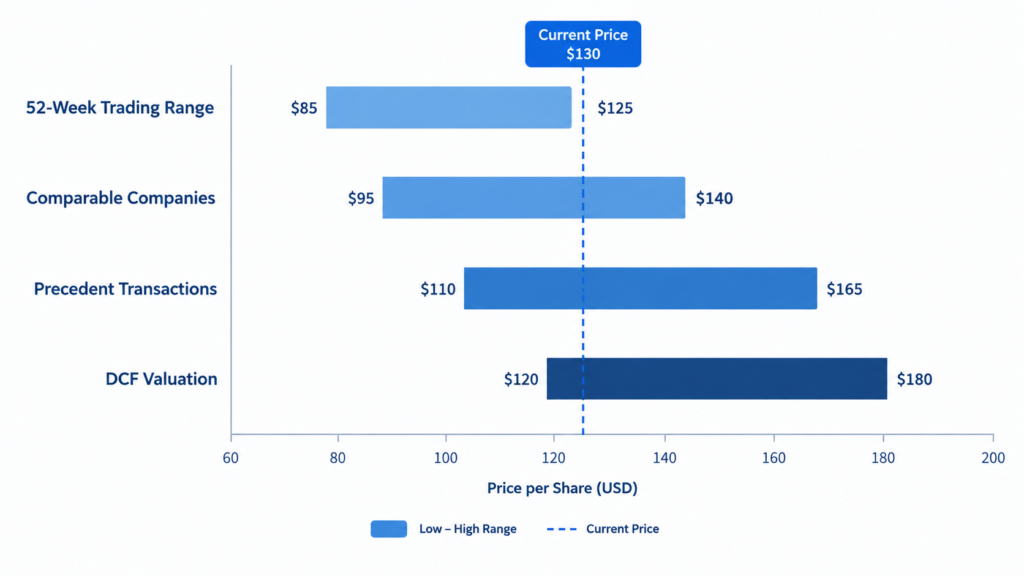
Target price setting rarely relies on just a single valuation method alone, since each individual technique carries its own assumptions, blind spots, and sensitivities that no single number can ever fully capture on its own.
Many analysts visualize their results using a football field chart, displaying value ranges from several methods side by side, making valuation triangulation far easier to communicate clearly and visually within any finished, published research report.
Weighting valuation methods appropriately, such as combining DCF and comps, produces a genuinely defensible valuation range rather than one single precise figure, acknowledging the real, genuine uncertainty inherent in forecasting any company’s uncertain future performance.
This blended price target methodology feeds directly into the broader analyst rating framework, where a clearly defined buy hold sell threshold ultimately determines how upside or downside potential translates into an actual, published investment recommendation.
A clear valuation summary chart, built through careful cross-checking valuation methods, supports this blended valuation approach, guiding final target price derivation and the closing upside downside calculation, reflecting genuine valuation convergence across all techniques used.
Common Mistakes and Red Flags in Equity Research Valuation
Among the most common valuation mistakes is overreliance on one method, treating a single DCF or comps output as gospel rather than just one single input among several reasonable, equally valid perspectives on company worth.
Unrealistic assumptions, often shaped by confirmation bias in valuation, can quietly push numbers toward a predetermined conclusion, undermining the very objectivity that equity research is genuinely meant and supposed to provide readers relying on it.
Using stale comparable companies or ignoring capital structure differences between businesses introduces further serious distortion, while terminal value overweighting remains a persistent, well-documented category of common valuation red flags across the entire research industry today.
Analyst bias, whether conscious or not, combines with simple model errors and outdated peer multiples to produce misleading conclusions, particularly when analysts overlook or ignore broader ignoring macro conditions shaping an entire industry sector’s outlook.
Careful valuation sanity checks help catch these issues early, since garbage in garbage out applies directly and consistently to financial modeling work. Consistent cross-checking valuation outputs against multiple methods remains the single best available safeguard.
Frequently Asked Questions
What is the most accurate valuation method in equity research?
There is no single most accurate valuation method in equity research, since every technique depends on assumptions that can prove wrong under changing market conditions, industry cycles, and company-specific circumstances that shift constantly over time.
Debates over DCF vs comps accuracy continue because the best valuation method depends heavily on situation, industry, data quality, and how far realistic assumptions can reasonably stretch beyond verifiable, observable historical company performance and trends.
This is why valuation method reliability improves most through combining several different techniques, rather than trusting any single, narrow no single best method philosophy, since blended approaches consistently reduce model-specific errors across many different industries.
What’s the difference between valuation in equity research and investment banking?
The core techniques overlap significantly, but equity research vs investment banking valuation differs mainly in overall purpose, intended audience, and how final conclusions eventually get used by investors, companies, and their respective boards of directors.
Equity research reflects sell-side vs buy-side valuation thinking, aimed at guiding ongoing investment decisions, while banking valuation instead supports specific deals, negotiations, and transaction pricing agreed between two counterparties directly and privately, off public markets.
This valuation purpose difference separates published research vs deal valuation work, since equity research generally supports ongoing coverage vs one-time deal analysis that instead stays tightly tied to a single, specific closing event over time.
How many valuation methods should an equity research report use?
Most thorough reports apply multiple valuation methods rather than one, since triangulating valuation across different techniques produces more reliable, well-supported conclusions than any single isolated figure could ever offer investors and analysts reading the report.
Comparing a single method vs multiple methods approach usually favors combination, since relying on just one single model alone leaves conclusions genuinely vulnerable to hidden, unexamined assumptions and quiet, easily overlooked modeling errors entirely today.
This thoughtful valuation method combination has become a widely accepted standard equity research practice, followed very consistently across most professional equity research coverage teams publishing regular reports for both institutional and retail clients alike worldwide.
What is the difference between enterprise value and equity value?
Understanding enterprise value vs equity value starts with the EV formula, which adds total debt and subtracts cash from equity value, capturing a company’s entire operating worth regardless of its underlying capital structure financing choices.
Enterprise value represents the whole underlying business, including outstanding financial obligations owed to lenders, while equity value instead reflects only the smaller residual portion genuinely belonging to remaining shareholders after those obligations are fully met.
The equity value formula reverses this same logic through a net debt adjustment, completing what analysts commonly call the valuation value bridge, connecting these two closely related but genuinely distinct financial figures used in practice.
Why do DCF and comparable company analysis often give different valuations?
A DCF vs comps discrepancy typically reflects a genuine intrinsic vs market valuation gap, where careful fundamentals-based projections consistently diverge quite meaningfully from current, real-time trading sentiment reflected broadly across public equity markets globally today.
This valuation method divergence can sometimes genuinely signal real market mispricing, where the broader stock market has clearly and repeatedly misjudged a company’s long-term future prospects relative to its true underlying business fundamentals over time.
More often, though, it simply reflects genuine assumption sensitivity built directly into the DCF model itself, rather than representing any clear, provable, easily actionable market error genuinely worth acting on right away, today or tomorrow.
How do you choose which valuation method to use for a specific company?
Choosing valuation method decisions depend heavily on established industry-appropriate valuation norms, since bank analysts, REIT analysts, insurance analysts, and technology analysts all consistently reach for quite different core valuation tools and frameworks entirely each time.
Company stage valuation method considerations matter too, since a young, fast-growing, unprofitable company almost always suits entirely different valuation tools than an older, mature, stable dividend payer with predictable, consistent earnings and steady cash flow.
Cash flow visibility and data availability for valuation further narrow these realistic choices considerably, shaping which specific methods genuinely make practical, defensible sense for any given company an analyst is carefully covering and publishing on.
What is terminal value and why does it matter so much in DCF?
Terminal value importance stems largely from its sheer relative size, since terminal value percentage of DCF often exceeds half of total estimated company worth across most typical models routinely built by most sell-side analysts today.
Because it captures every remaining cash flow beyond the explicit forecast window, terminal value carries truly enormous influence over the final overall valuation conclusion any analyst ultimately reaches and formally publishes to institutional clients everywhere.
Small shifts in terminal value assumptions, whether using Gordon growth vs exit multiple logic, can create surprisingly outsized swings in overall valuation results, which is exactly why terminal value sensitivity testing matters so much today.
Can valuation methods be used for private or pre-IPO companies?
Yes, though private company valuation and pre-IPO valuation require several meaningful adjustments, since these privately held businesses generally lack the constant daily pricing signals that public stock markets naturally and continuously provide to ordinary investors.
Illiquid company valuation work still borrows heavily from standard DCF and comps techniques, carefully adapting core equity research valuation logic to much sparser available data and far less frequent, directly observable market transactions overall today.
Analysts apply various carefully considered private valuation adjustments, including a meaningful lack of marketability discount, to reflect the significantly reduced liquidity that private company shareholders typically face when compared directly with public market investors today.