
What Are Leading and Lagging Indicators?
Every trader eventually meets two broad technical indicator categories: tools that predict future price moves and tools that confirm what already happened. Understanding this split helps you read chart indicators correctly instead of guessing at market direction.
A leading indicator definition centers on speed. These are forward-looking indicators built to signal a possible shift in price action before the shift fully develops on the chart, giving early entry opportunities to alert traders.
By contrast, a lagging indicator definition relies on completed data. These backward-looking indicators react after a move has started, offering trend confirmation rather than prediction, which is why many traders treat them as safety checks.
Both groups belong under the wider umbrella of momentum indicators and trend tools used across technical analysis indicators. Neither type is inherently superior; each simply answers a different question about market timing and direction.
The gap between when a signal appears and when the real move happens is called indicator lag. This indicator time-phase shapes how predictive indicators and confirming indicators generate trading signals for entries, exits, and risk decisions.
What Is a Leading Indicator?
A leading indicator is designed to move ahead of price, acting as an early warning signal before a trend actually shifts. Traders use it to anticipate change rather than react to something already confirmed on the chart.
Most leading tools are momentum based, measuring how fast price is moving rather than where it has been. Readings like overbought oversold conditions often hint at a coming trend reversal signal worth watching closely.
Popular examples include the RSI and the stochastic oscillator, both used to generate an entry signal ahead of price confirmation. Their speed is valuable, but it also increases the chance of false signals during choppy markets.
What Is a Lagging Indicator?
A lagging indicator confirms direction only after price has already moved, which is why it is closely tied to trend confirmation rather than prediction. It trades speed for dependability across most market conditions.
The moving average is the clearest example, since it smooths historical price data into a single line. This delayed signal filters out noise, helping traders see a confirmed trend instead of short-term price wobble.
Because lagging tools react late, they often work best as an exit signal rather than an entry trigger. A trend-following indicator built on smoothing techniques favors steady reliability over speed.
Key Differences Between Leading and Lagging Indicators
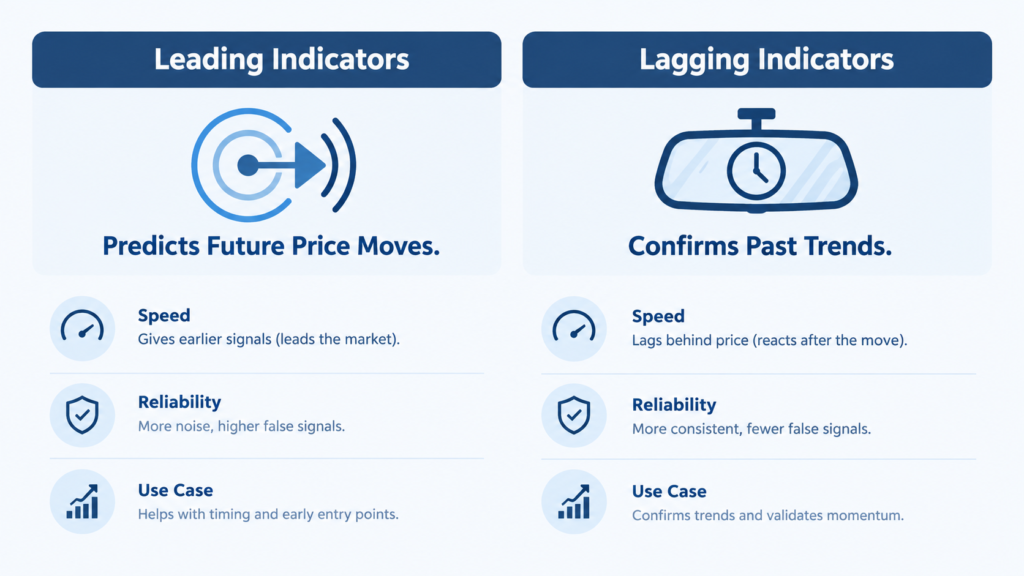
At the core, this is a leading vs lagging comparison of purpose. Leading tools aim to forecast, while lagging tools aim to verify, and that single distinction explains almost every practical indicator difference traders debate.
The clearest contrast lies in predictive vs confirming behavior. A leading tool tries to answer what might happen next, while a lagging tool answers what has already happened, based strictly on historical data rather than assumption.
Speed of signal separates the two groups sharply. Leading indicators react to real-time data almost instantly, while lagging tools need several completed price bars before confirming anything, which affects entry vs exit timing decisions.
That speed advantage comes with a cost: reliability of signal. Faster tools carry a higher risk of false signals, producing more false positives during sideways or choppy markets than slower, confirmation-based alternatives typically do.
Signal timing also affects trend identification itself. The indicator calculation method behind each tool determines its indicator responsiveness, and that responsiveness ultimately controls signal accuracy across different trading conditions and timeframes.
Types of Leading Indicators (With Examples)
Leading indicator examples span several distinct categories, each measuring a different aspect of market behavior. Some track momentum, others track volume, and some track sentiment across the wider market rather than a single asset.
Momentum-based tools like the RSI and stochastic oscillator remain the most widely used leading indicator examples. They flag overbought oversold zones, helping traders spot potential exhaustion points before a visible price reversal occurs.
Volume tells its own story about the conviction behind a move. Volume indicators such as on-balance volume measure buying and selling pressure, often shifting direction before price itself confirms the underlying change.
Sentiment indicators step outside pure price data entirely. Tools like the put call ratio, the VIX, and market breadth measures gauge crowd psychology, which frequently shifts ahead of major turning points in broader indices.
Price-based tools round out the leading category. The advance decline line and Fibonacci retracement levels help traders anticipate where a move may pause, reverse, or continue based on prior structure.
Momentum Oscillators
The RSI indicator, formally the relative strength index, measures the speed of recent price change on a bounded scale. It is one of the most common tools for momentum measurement across every trading style.
The stochastic oscillator works similarly but compares closing price to a recent trading range. Both tools flag an overbought level or oversold level, though neither guarantees an immediate reversal will actually follow.
Traders also watch momentum divergence, where price and the oscillator move in opposite directions. This mismatch inside the normal oscillator range often signals weakening strength behind the current trend.
Volume-Based Leading Indicators
On-balance volume, or the OBV indicator, adds or subtracts volume based on the day’s closing direction. This running total supports deeper volume analysis than price charts alone can typically provide.
When OBV rises while price stays flat, it often reflects growing buying pressure building beneath the surface. This quiet accumulation can precede a breakout that price charts have not yet shown.
The reverse pattern signals rising selling pressure, even if price looks stable. Traders often treat matching volume and price direction as volume confirmation that a move has genuine backing.
Sentiment and Market Breadth Indicators
The VIX volatility index measures expected market turbulence rather than direction itself. Sharp spikes often reflect fear, while low readings suggest complacency, both of which can hint at coming shifts.
The put/call ratio compares bearish and bullish options activity to reveal market sentiment. Because crowds often behave as a contrarian indicator, extreme readings sometimes precede a move in the opposite direction.
The advance/decline line tracks how many stocks are rising versus falling, supporting broader market breadth analysis. This gauge of investor sentiment and fear and greed often shifts before major indices turn.
Price Pattern and Retracement Tools
Fibonacci retracement levels mark where a pullback might pause within a larger trend. Traders combine these with Fibonacci extension targets to estimate how far a continuing move could realistically travel.
These tools work alongside support and resistance levels identified through prior price structure. Together they form the backbone of price pattern analysis used across many discretionary trading approaches.
Specific retracement levels, such as common Fibonacci ratios, often align with reversal zones where buyers or sellers historically stepped back into the market with renewed conviction.
Types of Lagging Indicators (With Examples)
Lagging indicator examples all share one trait: they need completed price movement before generating a usable signal. This delay is intentional, trading early entry for greater confidence in the underlying trend.
The simple moving average and exponential moving average remain the most familiar trend-following tools, smoothing out noise so traders can see the broader direction more clearly across weeks or months.
The MACD blends two moving averages into a single momentum-trend hybrid, while Bollinger Bands measure volatility around a moving average, together covering both direction and range in one view.
The parabolic SAR plots trailing stop points that follow an established trend, and the ADX indicator measures how strong that trend actually is, regardless of its direction.
A moving average crossover between a fast and slow line often marks a confirmed trend signal. Because these tools rely on completed data, they naturally lag behind sharp, sudden price reversals.
Moving Averages
The simple moving average SMA averages a fixed number of past closing prices equally. The exponential moving average EMA instead weights recent prices more heavily, reacting slightly faster to new information.
A moving average crossover occurs when a shorter average crosses a longer one. A golden cross suggests strengthening upward momentum, while a death cross often warns of weakening, bearish conditions ahead.
These crossovers are widely watched because they visually summarize trend direction in one glance. Their simplicity is part of the appeal, even though signals arrive well after a move has begun.
Trend Confirmation Indicators
The MACD indicator, short for moving average convergence divergence, tracks the relationship between two exponential averages to reveal shifting momentum alongside overall trend direction.
The ADX average directional index measures trend strength without indicating direction at all. Traders often pair it with directional tools to confirm whether a trend is worth following.
A signal line crossover within the MACD often marks a shift in momentum, adding another layer of trend confirmation before traders commit further capital to a position.
Volatility and Band-Based Indicators
Bollinger Bands expand and contract around a moving average based on recent volatility, visually showing when price is trading unusually far from its typical recent range.
The parabolic SAR doubles as a trailing stop indicator, adjusting closer to price as a trend matures and helping traders lock in gains without exiting too early.
Traders watch for a price band squeeze, where bands tighten before a band breakout, since this pattern often precedes a significant increase in overall volatility measurement.
Leading vs Lagging Indicators Cheat Sheet (Quick Reference Table)
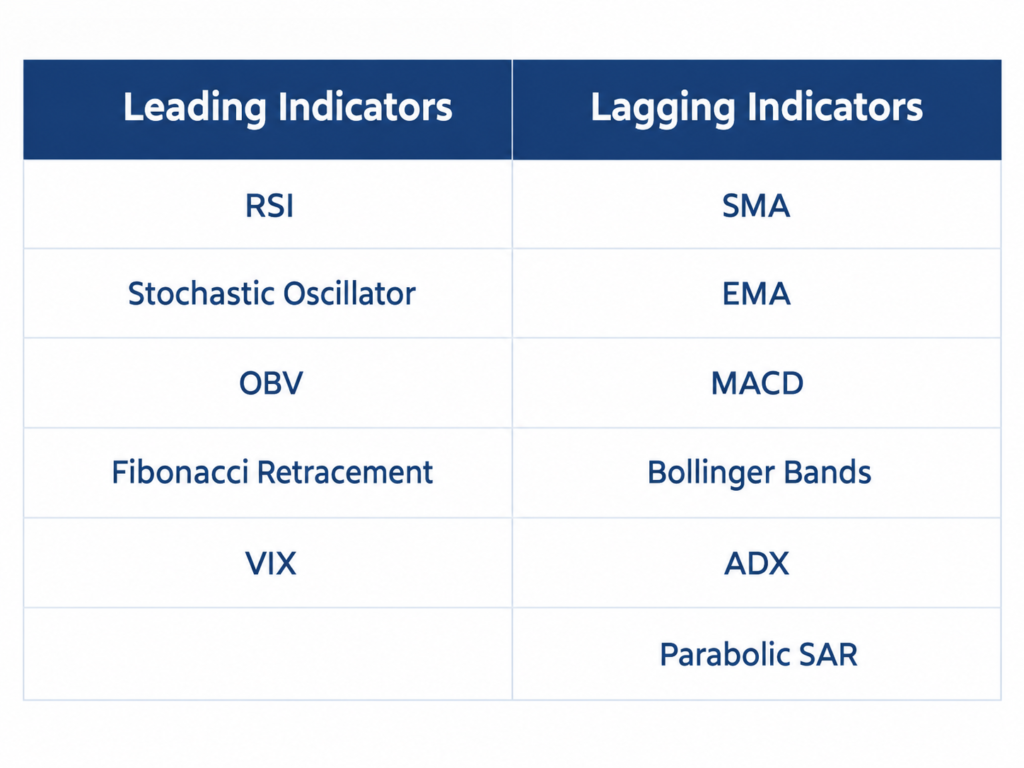
A simple indicator cheat sheet makes the differences easier to remember at a glance, especially for newer traders still building comfort with reading multiple tools together on one chart.
An indicator comparison table typically lists each tool alongside its category, purpose, and typical use case, functioning as a quick reference guide during live trading decisions rather than deep study sessions.
| Indicator | Type | Primary Use |
| RSI | Leading | Momentum, overbought/oversold |
| Stochastic Oscillator | Leading | Momentum, reversal timing |
| OBV | Leading | Volume confirmation |
| VIX | Leading | Sentiment, volatility |
| Moving Average | Lagging | Trend confirmation |
| MACD | Hybrid | Trend and momentum |
| Bollinger Bands | Lagging | Volatility range |
| ADX | Lagging | Trend strength |
This indicator classification list separates tools by category, though a few names like MACD sit in a gray area, which the next section explores through the classic RSI vs MACD comparison.
Comparing moving average vs oscillator behavior side by side highlights the core tradeoff again: smoother, delayed confirmation versus faster, noisier prediction, each suited to different trading temperaments and goals.
Keep this indicator lookup table nearby as a technical indicator summary while studying charts. Over time, this indicator type chart becomes less of a reference and more of a mental habit, part of any working trading indicator glossary.
Why Indicator Classification Isn’t Always Clear-Cut
Not every tool fits neatly into one box. Some hybrid indicators blend predictive and confirming traits, which is exactly why textbook definitions sometimes clash with how traders actually use them in practice.
The MACD classification debate is a good example. Some call it leading because it reacts to momentum shifts, while others call it lagging since it is built entirely from moving averages of past prices.
This indicator ambiguity often comes down to interpretation rather than a strict technical rule. The core leading vs lagging disagreement persists partly because trading communities emphasize different aspects of the same formula.
Indicator settings impact classification too. Shortening the indicator parameters on a moving average makes it react faster, blurring the line between a confirming tool and a more predictive one.
This is why context-dependent classification matters more than rigid labels. Common indicator misconceptions often ignore that many tools behave as dual-purpose indicators, and accurate indicator interpretation depends heavily on how a trader actually applies them.
How to Combine Leading and Lagging Indicators in a Trading Strategy
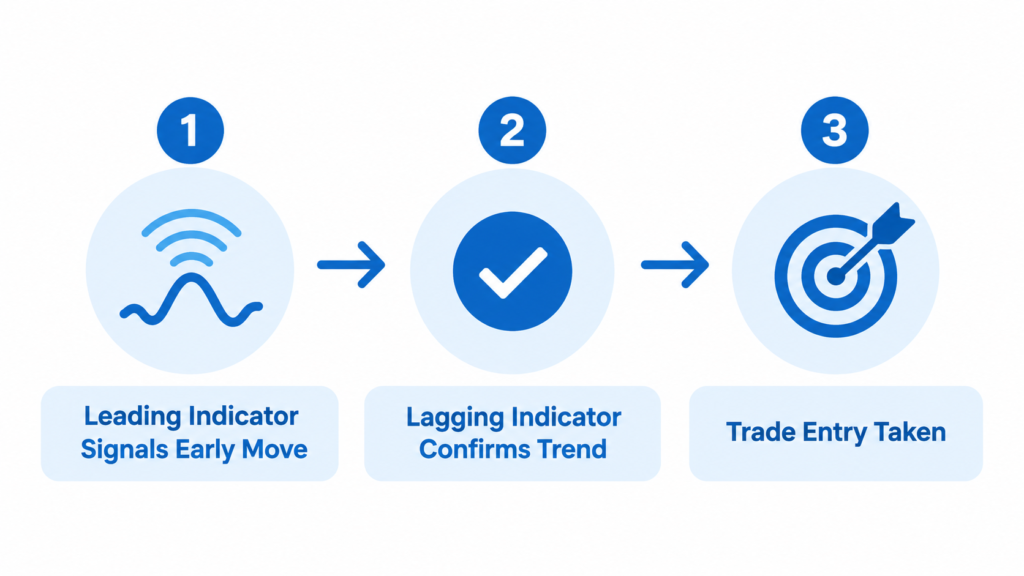
Combining indicators thoughtfully often produces steadier results than relying on any single tool alone. A well-built confirmation strategy balances the speed of leading signals against the dependability of lagging ones.
Indicator stacking works best when each tool answers a different question instead of repeating the same information. Pairing momentum with trend strength, for example, avoids redundant signals cluttering the same chart.
Multi-timeframe analysis adds another layer of context. Checking a higher timeframe for overall direction before acting on a lower timeframe signal helps with reducing false signals during noisy, short-term price swings.
A solid trading strategy framework treats entry and exit signals as separate decisions. Leading tools often trigger entries, while lagging tools frequently confirm exits once a trend has clearly run its course.
Seeking indicator convergence, where multiple tools agree, supports a stronger trend confirmation strategy. This kind of signal confluence also reduces whipsaw reduction issues compared to trading off one indicator alone, though indicator overload and thorough backtesting indicators both deserve careful attention within risk management.
The Confirmation Strategy (Leading Signal + Lagging Confirmation)
A common confirmation strategy pairs a fast leading signal with a slower lagging check before acting. This combination aims for signal confluence, where both tools agree before a position opens.
For example, an oversold RSI reading might prompt attention, but waiting for a moving average to turn up adds entry confirmation and supports genuine trend validation before committing capital.
This dual indicator approach is popular precisely because it targets reducing false entries. It sacrifices some speed for a meaningfully higher degree of confidence in the setup.
Using Multiple Timeframes Together
Multi-timeframe analysis starts with the higher timeframe trend, establishing the broader direction before zooming into shorter charts for precise timing on entries and exits.
Once the larger trend is clear, traders look for a lower timeframe entry that aligns with it. This timeframe alignment helps avoid fighting the dominant, longer-term direction.
This method, often called top-down analysis, relies on timeframe confirmation across at least two chart windows before a trader feels confident acting on any single signal.
Common Mistakes When Combining Indicators
Indicator overload is a frequent trap, where traders add tool after tool until the chart becomes cluttered and genuinely harder to read rather than clearer.
Conflicting signals often appear when similar indicators are stacked together, since tools built on comparable formulas rarely disagree, creating a false sense of confirmation.
Over-optimization, sometimes called curve fitting, happens when settings are tuned perfectly to past data. Removing redundant indicators helps prevent both this trap and analysis paralysis from too many inputs.
Which Indicator Type Fits Your Trading Style?
Trading style and indicators should always be matched carefully, since a tool built for fast decisions rarely suits someone holding positions for weeks or months at a time.
Day trading indicators tend to favor speed and responsiveness, while position trading indicators favor stability and confirmed direction over shorter-term noise that fast traders actively seek out.
Swing trading indicators typically sit between these two extremes, balancing momentum signals with trend confirmation tools to capture moves lasting several days to a few weeks.
Long-term investing indicators lean heavily lagging, since patient investors generally prioritize confirmed trends over the earlier, noisier signals preferred by short-term traders chasing quick moves.
Indicator selection by timeframe ultimately depends on personal temperament as much as strategy. A clear trading style guide and honest view of indicator suitability matter more than chasing someone else’s timeframe-based strategy, especially for anyone new to scalping strategy approaches.
Day Traders and Scalpers
Day trading and scalping strategy approaches demand speed above almost everything else, since positions often close within minutes rather than being held overnight or longer.
Short-term momentum tools like the RSI or stochastic oscillator fit naturally here, offering fast signals that match the pace of rapid intraday decision-making.
These intraday trading indicators prioritize responsiveness over reliability, accepting more false signals in exchange for the speed genuinely required at this trading pace.
Swing Traders
Swing trading typically spans several days to a few weeks, giving traders more room to combine both indicator types without needing instant reactions.
A balanced indicator approach often pairs a leading tool for timing entries with a lagging tool for confirming the broader multi-day trends already in motion.
This trend and momentum combination suits the medium-term holding periods swing traders prefer, avoiding the noise of very short timeframes entirely.
Position Traders and Long-Term Investors
Position trading and broader long-term investing both favor patience, meaning confirmed signals usually matter far more than catching the very earliest possible entry point.
A strong trend confirmation focus suits this style well, since low-frequency trading naturally tolerates the delay that comes with lagging indicators.
These traders generally rely on macro trend following, checking in periodically rather than watching charts constantly throughout each trading day.
Pros and Cons of Leading vs Lagging Indicators
Every tool involves tradeoffs, and understanding both the advantages and disadvantages of each indicator type helps traders set realistic expectations before relying on any single signal.
Indicator limitations exist on both sides of this comparison, meaning no single tool eliminates risk entirely, regardless of how it is marketed or discussed online.
The core indicator benefits usually involve either speed or reliability, rarely both at once, since faster tools inherently carry a higher risk of false signals.
Meanwhile, delayed signal risk affects slower, confirming tools, since waiting for certainty often means missing the earliest, most profitable portion of a move.
These indicator trade-offs explain why experienced traders rarely rely on just one category, instead blending tools based on their own goals and risk tolerance.
Advantages and Limitations of Leading Indicators
The clearest early entry advantage comes from catching a move before the wider market fully recognizes it, potentially improving overall trade positioning and timing.
However, this speed brings real false signal risk, since momentum can reverse quickly without ever developing into the trend a trader initially anticipated.
Their predictive accuracy faces genuine momentum-based limitations, particularly around reversal timing, which raises legitimate signal reliability concerns during highly volatile trading conditions.
Advantages and Limitations of Lagging Indicators
The main confirmed trend advantage is added confidence, since a signal only appears after a trend has clearly and measurably established itself.
The obvious tradeoff is a delayed entry drawback, often resulting in missed early moves that leading indicators might have caught much sooner.
Still, this reliability benefit appeals to cautious traders, even with known trend-following limitations, largely because it offers meaningfully reduced whipsaw risk.
Frequently Asked Questions
What is the main difference between a leading and a lagging indicator?
The main difference comes down to timing: leading indicators attempt prediction, while lagging indicators offer confirmation. This predictive vs confirming split is the core distinction behind nearly every signal timing difference discussed in this indicator definition comparison.
Is RSI a leading or lagging indicator?
The RSI classification places it firmly among leading indicator example tools. As a momentum oscillator, the relative strength index measures speed of price change, often flagging RSI overbought oversold conditions before a visible reversal occurs.
Is MACD a leading or lagging indicator?
The MACD classification is genuinely debated among traders. Built from moving average convergence divergence, it functions largely as a trend-following tool, though its MACD histogram can react early enough that many describe it as a hybrid indicator.
Which is better: leading or lagging indicators?
There is no clear winner in this leading vs lagging comparison, since each serves a different purpose. Which indicator is better ultimately depends on indicator suitability for your personal trading strategy fit and risk tolerance.
Can you use leading and lagging indicators together?
Yes, combining indicators is a common and practical approach. A confirmation strategy built through indicator stacking allows dual indicator use to strengthen signal confluence, reducing the weaknesses found in either type alone.
What are the most reliable lagging indicators for confirming a trend?
Among the most cited reliable lagging indicators are moving averages, valued for their moving average reliability as core trend confirmation tools. MACD trend confirmation and ADX trend strength readings are also commonly used together.
Do leading indicators give more false signals than lagging indicators?
Generally, yes. The false signal rate tends to be higher due to inherent leading indicator risk, including more frequent whipsaw signals. This signal accuracy comparison is exactly why reducing false signals through confirmation remains important.
How do beginners choose between leading and lagging indicators?
For beginner trading indicators, starting simple usually works best. Focus on choosing indicators that fit your natural trading style match, favor a simple indicator strategy at first, and use a basic indicator selection guide before adding complexity.