
Introductions
The statement of stockholders’ equity tracks how a company’s ownership value shifts across a reporting period. It ranks among the five required financial statements that a publicly traded business must prepare on an ongoing basis for shareholders, analysts, and other readers.
This financial statement is also called the statement of changes in equity, and it works alongside the balance sheet and income statement. Together, these four general purpose financial statements give a fuller picture of a US company’s financial health and daily business activities.
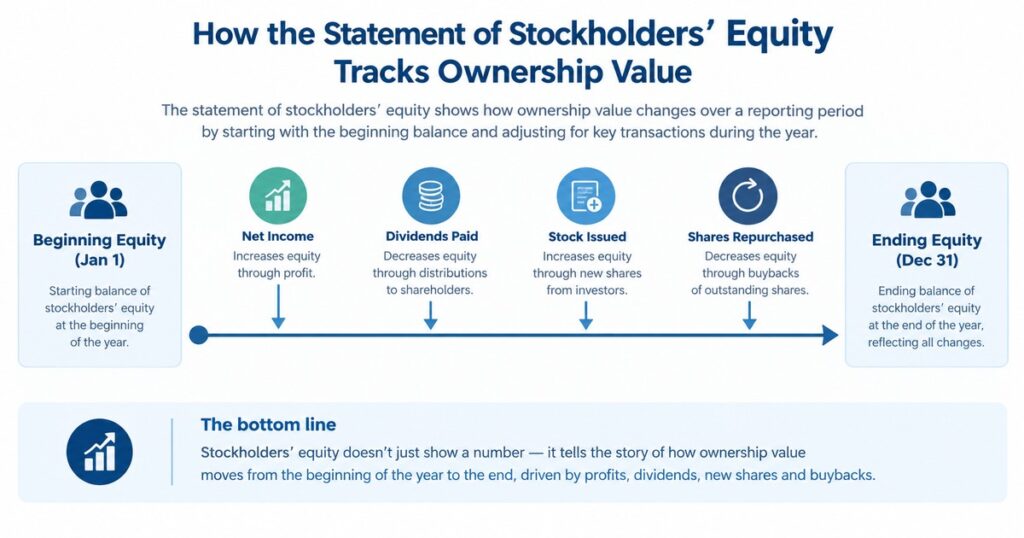
The document begins with beginning equity recorded at the start of the period, often January 1, and ends with the ending equity balance on December 31. Every equity-related activity in between gets recorded and summarized for the entire accounting year.
Items that move the equity balance include net income, net losses, dividend payments, stock sales, and share buybacks. Each transaction either adds to or begins subtracting from the shareholders’ stake, showing the impact of daily decisions on ownership value.
The purpose of this second financial statement is transparency. It gives investors additional information beyond total assets and total liabilities, helping them understand movement in equity accounts and common stock over a designated period of time.
Structure / Format of the Statement
Most companies prepare this statement using a matrix layout instead of a single column of numbers. Column headers list equity accounts such as common stock, additional paid-in capital, retained earnings, and treasury stock, each tracked separately across the year.
Rows typically show the beginning balance, followed by additions like net income and subtractions such as dividends or stock purchased back by the company. This grid pattern helps a reader trace every adjustment without confusion.
The heading at the top states the title of statement, the name of the company, and the time period covered, often phrased as “year ended December 31 2015.” This mirrors how an annual income statement presents its own reporting consistency.
Near the bottom, a totals column lists grand total figures for total shareholders’ equity, sometimes separated to show non-controlling interests apart from the parent’s own ownership interest. The last line always displays the final ending shareholders’ equity.
| Row / Line Item | Common Stock | Additional Paid-In Capital | Retained Earnings | Treasury Stock | Total Equity |
| Beginning Balance | ✓ | ✓ | ✓ | ✓ | ✓ |
| Net Income | — | — | + | — | + |
| Dividends Declared | — | — | − | — | − |
| Stock Issued | + | + | — | — | + |
| Stock Repurchased | — | — | — | − | − |
| Ending Balance | ✓ | ✓ | ✓ | ✓ | ✓ |
Whether the business was profitable or not profitable during the period, the format stays consistent. Owners, preferred stock holders, and holders of other classes of shares can all see their elements of equity on their own line.
Columns / Line Items / Components Appearing on the Statement
Common line items include common stock issued, preferred stock, additional paid-in capital, retained earnings, and treasury stock. Some annual filings also separate class A and class B shares because each carries different voting rights and par value.
| Line Item | What It Represents |
| Common Stock | Par value of shares issued to shareholders |
| Preferred Stock | Value of shares with priority claims over common stock |
| Additional Paid-In Capital | Amount raised from investors above par value |
| Retained Earnings | Cumulative profits kept in the business rather than paid out |
| Treasury Stock | Value of shares the company has repurchased and holds itself |
Accumulated other comprehensive income captures unrealized gains and unrealized losses from sources like cash flow hedge activity or foreign exchange reserve swings. A revaluation surplus from property, plant and equipment may also appear here for many reporting entity filers.
Non-controlling interests, sometimes called minority interests, reflect a subsidiary’s equity not owned by the parent. This distinction matters during mergers, since outside owners still hold a priority claim on a portion of total stockholders’ equity.
Activity columns often show sale of common stock, exercise of stock options, stock-based compensation, and repurchases such as buy back shares or repurchase of common stock. Each column links a specific transaction type to its dollar effect on beginning balances.
Investors reviewing a Form 10-K can trace cash dividends declared, net income, or net loss by profit or loss through detailed amounts listed for three years. The table of contents in investor relations filings usually points straight to this 10-K section.
Example of the Statement
Consider a simplified example modeled on filings like those from Hershey Company or Apple. A balance on January 1 might show common stock at $1bn, retained earnings at $5,000,000, and treasury stock as a negative (1,600,000) balance.
During the year, the company recorded net income of $61,000,000, along with dividend payments of (2,000) and a purchase of treasury stock worth (3,000,000). Issuance of common stock through stock-based compensations adds 10,000 more shares to circulation.
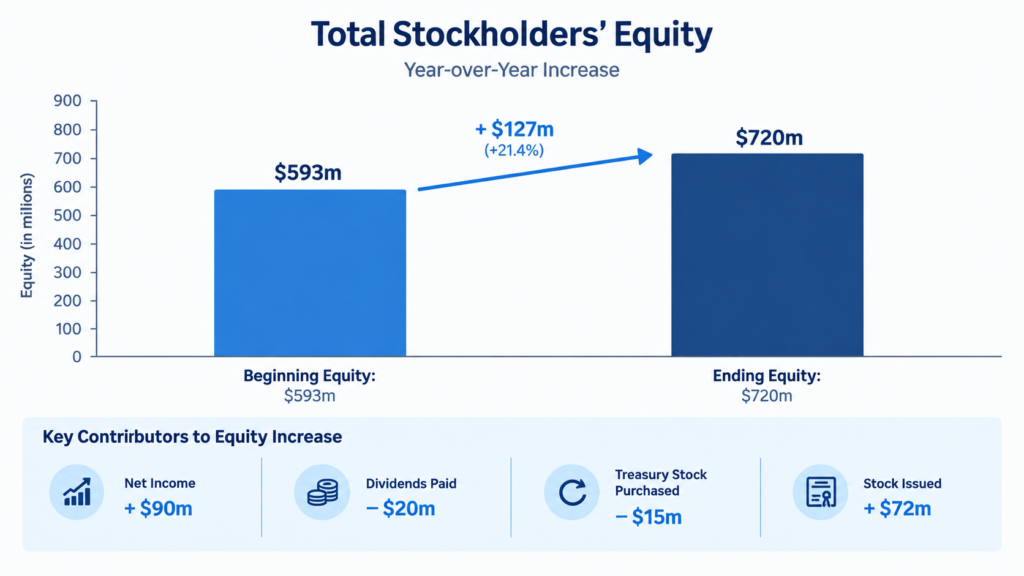
By the balance on December 31st 2016, total stockholders’ equity might rise from $593m to $720m, a clear increase reflecting a healthy, rising trend. This kind of movement appears often within consolidated statements of stockholders’ equity.
| Line Item | Amount |
| Common Stock (Jan 1) | $1bn |
| Retained Earnings (Jan 1) | $5,000,000 |
| Treasury Stock (Jan 1) | (1,600,000) |
| Net Income | $61,000,000 |
| Dividend Payments | (2,000) |
| Purchase of Treasury Stock | (3,000,000) |
| Stock-Based Compensation Issuance | 10,000 shares |
| Total Stockholders’ Equity (start) | $593m |
| Total Stockholders’ Equity (Dec 31, 2016) | $720m |
A share repurchase program may reduce outstanding shares while a share buyback program signals confidence, though outcomes vary by company. Accumulated other comprehensive income might shift due to other comprehensive income items unrelated to core annual earnings.
Analysts often cross-reference these figures against the 2024 10-K filing or prior 12-month plans to judge whether the overall equity position is shrinking or expanding. A fictional company like XYZ Ltd could be used for practice.
Calculation of Shareholder’s Equity
The basic formula for shareholder’s equity is total assets minus total liabilities. This simple difference produces a snapshot of net worth at any single point, reflecting the residual claim owners hold after every liability is covered.
Shareholder’s Equity = Total Assets − Total Liabilities
Where:
- Total Assets = Everything the company owns with measurable value
- Total Liabilities = Everything the company owes to outside parties
Retained earnings and contributed capital both feed into this figure, since they represent money the company kept or raised from owners. Together they build up the overall shareholder equity balance shown on the balance sheet.
This calculation also reveals financial health. A rising figure over time generally suggests assets are growing faster than liabilities, while a shrinking or negative result can point toward strain within the underlying business.
Because the balance sheet already lists assets and liabilities separately, this formula offers a quick cross-check. If the reported shareholder’s equity does not match, it flags a possible error worth investigating further.
Importance / Why Use the Statement
This statement helps shareholders, management, and outside parties judge how well a company is generating profitability from its business activities. It explains movements in individual equity accounts that the income statement alone cannot show.
Investors use it to gauge market sentiment and to see whether sales and decisions made during the accounting period support future capital raising. A steady rise in equity accounts often signals stability.
Management relies on this statement when weighing future issuances of stock shares or when repatriating funds. It shows whether the equity position can absorb new investment without breaching internal limits.
Lenders reviewing a loan or debt agreements may require minimum equity levels before approving credit. This statement offers direct evidence of whether those thresholds are currently being met or exceeded.
Analysts also compare this data against competitors, since fluctuations across the equity accounts can reveal shifts in company strategy, such as new stock shares issued or a change in dividend policy.
Terms Similar To / Also Known As
Several names describe the same underlying financial statement. Common versions include the statement of shareholders’ equity, statement of stockholders’ equity, and simply the statement of equity, all referring to identical reporting requirements.
Other equivalent titles are the statement of changes in equity and the longer statement of changes in shareholders’ equity. Some filings also use the statement of changes in stockholders’ equity, depending on company preference or jurisdiction.
Regardless of the label chosen, every version tracks the same underlying data. Readers should not assume differing terminology signals a different type of report, since the content and purpose remain the same.
Who Uses a Statement of Shareholder Equity?
Investors rely on this statement to understand detailed information about movements within a specific accounting period. They study changes in equity accounts to judge whether their ownership interest is gaining or losing value.
Analysts use the report to evaluate business activities and spending patterns, especially when a company announces a share buyback program. This helps them form reasons behind broader recommendations to their own clients.
Companies themselves reference this document internally, since it links directly to the balance sheet and provides transparency for planned decisions ahead of the next period, including capital raises or dividend changes.
What is Shareholders’ Equity?
Shareholders’ equity represents the residual claim owners hold on existing assets once every liability is settled. It equals total assets minus total liabilities, giving a clear view of net worth at the end of a period.
Line items within this category include common stock, preferred stock, retained earnings, treasury stock, and additional paid-in capital. Each reflects a different source of ownership interest built up since the beginning of the accounting period.
Accumulated other comprehensive income (loss) also sits within this section, capturing gains or losses not yet realized. Non-controlling interests may appear too, when a reporting entity consolidates a subsidiary it does not fully own.
A positive shareholders’ equity figure is generally seen as reflecting sound financial health, while a negative one raises questions. The statement of shareholders’ equity provides the transparency needed to explain how that figure changed.
Items Affecting Shareholder’s Equity
Net income and net loss are the most direct drivers of total shareholders’ equity, since profits flow into retained earnings while losses reduce it. Every transaction tied to earnings eventually touches this section.
Cash dividends paid to owners reduce net shareholders’ equity, while a bonus share issue or issue of new share capital can increase the stock component without any new cash coming into the business.
A treasury stock purchase lowers equity, but a later sale of treasury stock partially reverses that reversal. Meanwhile, a revaluation of fixed assets can create a revaluation surplus tied to fixed asset revaluation.
Foreign exchange swings affect the foreign exchange reserve, and a change in accounting principle may require a financial statement restatement. Both sub-factors can shift historic total comprehensive income figures reported in prior periods.
An additional paid-up capital contribution from shareholders adds directly to equity, separate from earnings. These sub-factors combined explain why retained earnings alone rarely tells the full equity story.
Interpretation and Decisions Based on Stockholders Equity Statement
Investors read this statement to judge how well management allocates resources across a reporting period. A steady climb in equity often guides confidence, while stagnation or decline may prompt closer scrutiny of underlying decisions.
Shareholders compare current figures against prior periods to spot patterns in dividends, buybacks, or new stock issuance. This context helps them evaluate whether management’s recent choices align with long-term ownership interests.
Beyond raw numbers, the interpretation also considers timing. A dip tied to a one-time share buyback program reads differently than a decline caused by sustained net losses across several reporting periods.
Further Issue of Shares
A company may pursue a further issue of common stock when it needs to garner resources for expansion or new projects. This route lets existing equity grow without relying on additional debt.
Shares may be offered as fully paid up or as a partly paid share, with a final call collected later. This opportunity gives the company flexibility in how it stages incoming capital.
In the normal course of business, understanding these mechanics helps shareholders anticipate dilution. Reviewing the statement afterward shows exactly how the further issue affected total equity figures.
Buy Back of Shares
A buy back reduces the number of floating shares in circulation, often chosen by management when they believe shares are undervalued. This decision can also reduce excess liquidity sitting on the books.
Panic selling driven by market rumors sometimes prompts a buy back, as management tries to restore confidence. A large number of shares repurchased can shift perception among both investors and competitors.
Whether the move increases long-term worth depends on price paid versus underlying value. The statement later reflects this activity within the treasury stock line for that reporting period.
Dividend Declaration
A dividend declaration is a judicious decision balancing shareholder reward against the need to conserve cash for growth. Management weighs the quantum of the payout against expected ROI from reinvestment opportunities.
Choosing to plough back profits instead of distribution of dividend can fund the growth of company operations. This tradeoff appears directly in the retained earnings column of the statement.
The final shareholding structure and payout resources available both shape how large a distribution can be. Each declaration reduces equity, which the statement captures within the relevant reporting period.
Employee Stock Option Plan (ESOP)
An ESOP grants employees the right to subscribe to equity stock at a set price after a vesting threshold is met. Management designs the scheme to align staff incentives with company performance.
The money collected from employees exercising options flows into additional paid-in capital, while new shares increase the quantum of outstanding common stock shown on the statement.
Whether employees hold or sell their shares later depends on personal decision, but the success of the scheme is often judged by participation rates and how it affects overall company morale.
Positive vs. Negative Shareholder Equity
Positive shareholder equity generally signals that assets comfortably exceed liabilities, reflecting sound financial health. Companies like Apple have historically reported strong positive shareholder equity across multiple reporting periods.
Negative shareholder equity is less common and can serve as a red flag for investors, though it is not always unusual. A large share buyback program or negative retained earnings can sometimes explain the shortfall.
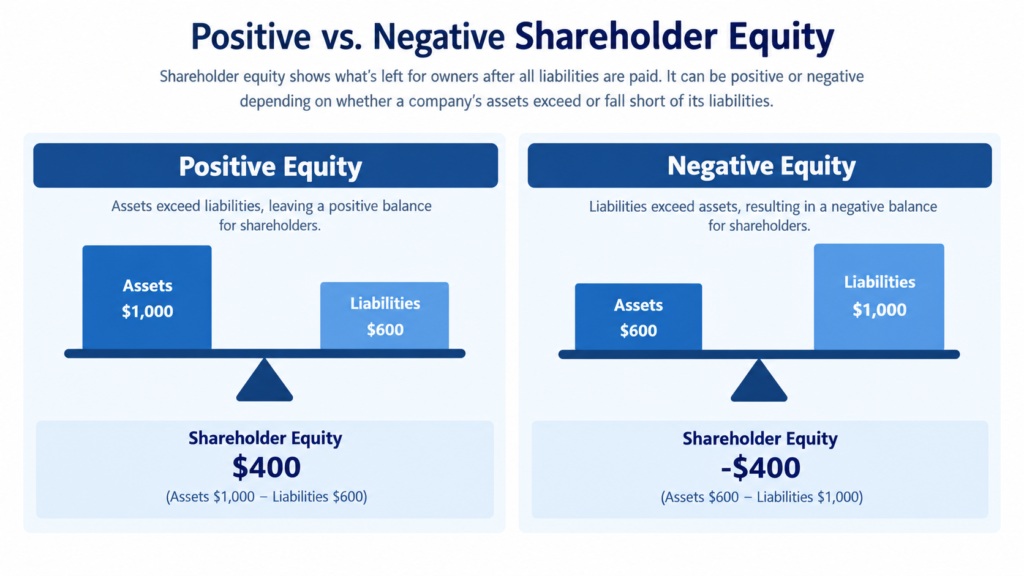
Persistent negative shareholder equity paired with financial distress deserves closer attention. The statement of shareholders’ equity helps determine whether the drop was planned or a symptom of deeper trouble.
Statement of Owner’s Equity vs. Cash Flow Statement
The statement of owner’s equity tracks changes in equity accounts over a specific period, while the cash flow statement tracks cash inflows and cash outflows across the same window of time.
Both statements can show capital raising activity, but the cash flow statement records actual cash movement, while the statement of owner’s equity reflects accounting value generated or reduced through transactions.
Repatriating funds, for instance, affects cash directly, yet its impact on equity depends on how it is classified. Reading both reports together gives more detailed information than either used alone.
Conclusion
The statement of shareholders’ equity brings together every movement in ownership interest across a specific accounting period. From the beginning of the accounting period through the end, it tracks how equity accounts evolved.
By pairing this data with the income statement, total assets, and total liabilities, investors and analysts gain a fuller view of financial health, capital raising efforts, and business activities overall.
Ultimately, this statement exists to protect transparency. Whether tracking net worth, retained earnings, or repatriating capital, it gives shareholders and the company itself a shared record of detailed information.
Frequently Asked Questions
What is stockholders’ equity?
Stockholders’ equity is the residual value owners hold in a company after subtracting all liabilities from total assets, representing their ownership stake.
It includes components like common stock, retained earnings, and treasury stock, all combined into one overall ownership figure reported on the balance sheet.
This figure changes constantly as a business earns income, pays dividends, or issues new shares, which is exactly what the equity statement documents in detail.
Is it okay to have negative amounts in the equity section of the balance sheet?
Negative amounts in the equity section of the balance sheet are uncommon but not automatically alarming, since context always matters when interpreting the figure.
A history of large negative amounts paired with mounting losses can suggest financial strain, while a temporary dip tied to buybacks may simply reflect a deliberate choice.
Readers should review several periods of the balance sheet together, rather than judging the equity section from a single reporting date in isolation.
What are the stockholders’ equity accounts?
Stockholders’ equity accounts typically include common stock, preferred stock, additional paid-in capital, retained earnings, treasury stock, and accumulated other comprehensive income or loss.
Each account tracks a distinct source of ownership value, whether from shares issued, profits kept, or unrealized gains and losses tied to specific asset classes.
Together, these accounts sum to the total equity figure shown at the bottom of the statement, giving a full breakdown behind that single number.
What is the return on stockholders’ equity (after tax) ratio?
The return on stockholders’ equity ratio measures how efficiently a company turns owner investment into profit, calculated using after tax net income divided by average equity.
Return on Stockholders’ Equity = (Net Income After Tax ÷ Average Stockholders’ Equity) × 100
Where:
- Net Income After Tax = Profit remaining after all taxes are paid
- Average Stockholders’ Equity = (Beginning Equity + Ending Equity) ÷ 2
A higher ratio generally suggests the business generates strong returns relative to the capital shareholders have contributed, though comparisons work best within the same industry.
This ratio complements the equity statement by showing performance relative to size, rather than just the raw dollar change in ownership value over time.
What is the debt to equity ratio?
The debt to equity ratio compares total liabilities against total shareholders’ equity, showing how much of the company is financed through borrowing versus ownership capital.
Debt to Equity Ratio = Total Liabilities ÷ Total Shareholders’ Equity
Where:
- Total Liabilities = All amounts owed to outside parties
- Total Shareholders’ Equity = Total assets minus total liabilities
A higher ratio indicates heavier reliance on debt, which can increase risk during downturns, while a lower ratio suggests a more conservative capital structure overall.
Analysts often track this ratio alongside the equity statement to see whether rising liabilities are outpacing growth in the underlying ownership base.
Does the income statement explain the change in the equity section of a balance sheet?
The income statement explains only part of the change in the equity section of a balance sheet, specifically the portion tied to net income or net loss.
Other movements, like dividend payments, share buybacks, and new stock issuance, do not appear on the income statement but still affect the equity balance directly.
This is exactly why the statement of stockholders’ equity exists separately, capturing every source of change that the income statement alone cannot fully explain.