
What Is an Annual Report (and Who Needs to Read One)
An annual report is a yearly document a publicly traded company publishes for its owners, summarizing performance across the prior financial year. It blends narrative storytelling with hard numbers, giving readers a structured window into how the business actually performed.
Unlike a quick news update, an annual report is deliberately comprehensive. It covers strategy, results, risk, and governance in one place, making it the single most complete document a company produces about itself during any given fiscal year cycle.
The audience is broader than most people assume. Current shareholders read it to track their investment, but prospective investors, employees, job seekers, suppliers, and even competitors mine the same shareholder report for insight into direction and financial health.
Compared with an annual report vs quarterly report, the annual version carries far more weight. Quarterly updates are short snapshots; the annual document is audited, exhaustive, and meant to stand as the authoritative record of the company’s full-year story.
Learning to navigate this document is a practical skill, not an academic one. Whether the goal is evaluating a company for a job, a partnership, or an investment, the annual report is where that judgment should begin.
Annual Report vs. 10-K vs. Shareholder Summary What’s the Difference
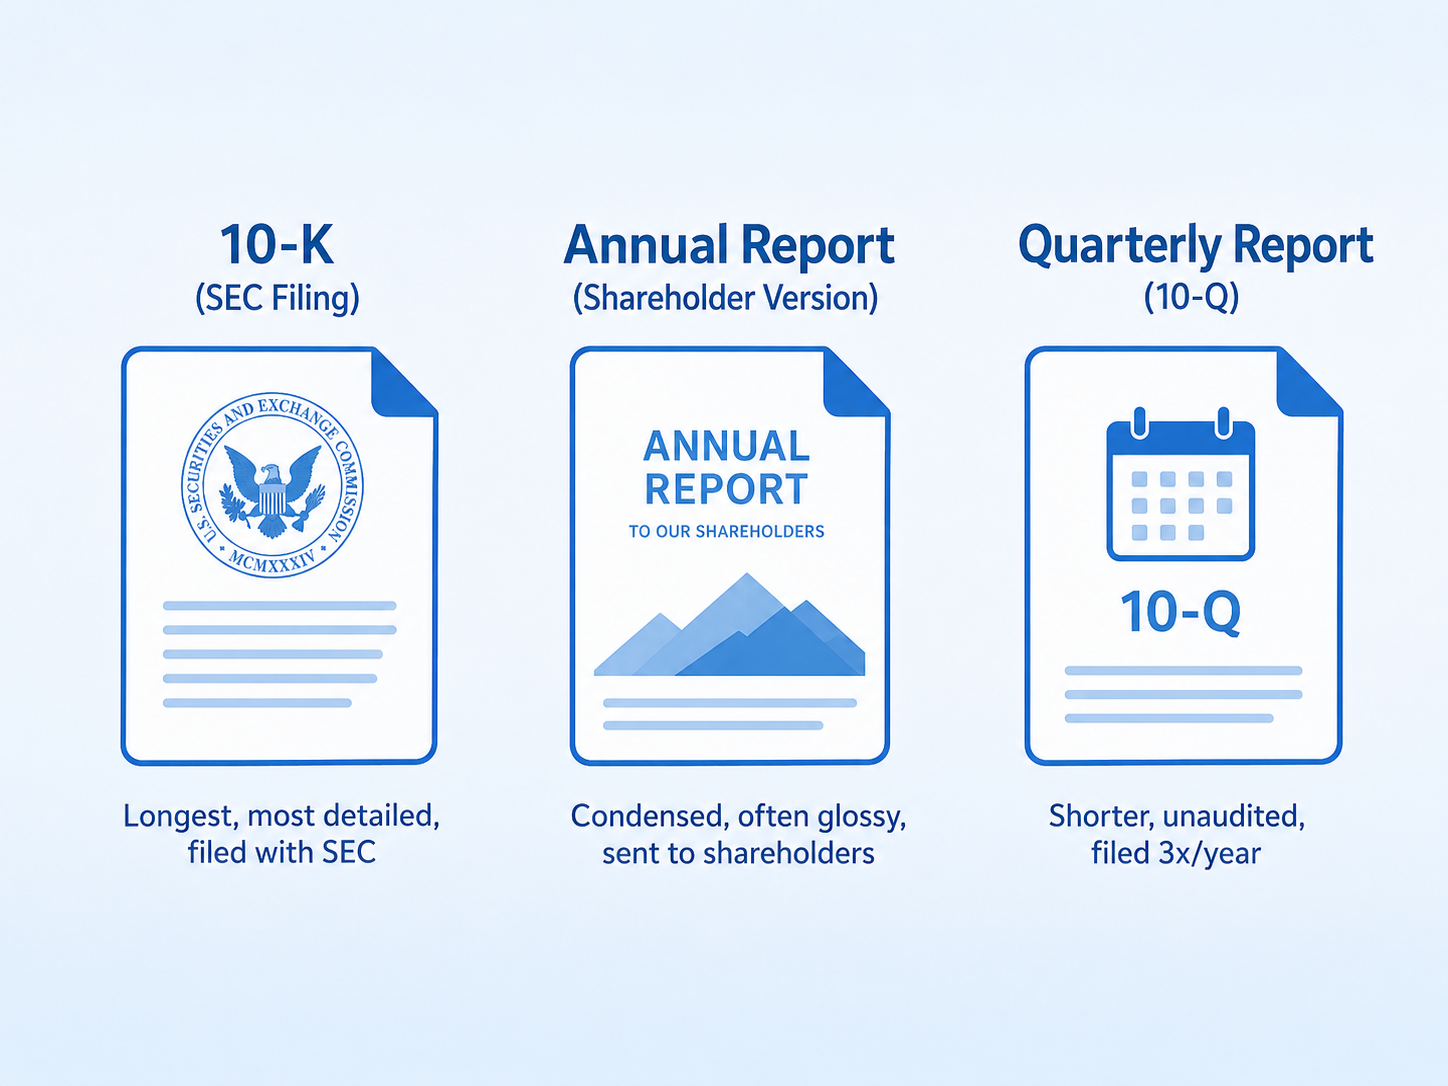
The SEC Form 10-K is a regulatory filing, required by law for most U.S. public companies. It follows a strict format, includes legal disclosures, and prioritizes completeness over readability, since regulators are its primary intended audience.
A glossy annual report, by contrast, is a marketing document in spirit even when factual in substance. Companies design it to be visually appealing, often including photography, executive commentary, and highlights chosen specifically to frame the year favorably.
Many companies now merge the two into what’s known as a 10-K wrap, combining the regulatory filing with polished design elements. Readers should recognize which version they’re holding, since tone and emphasis can differ substantially between formats.
Why Learning to Read One Matters
Financial literacy starts with primary documents, not secondhand summaries. Reading an annual report directly, rather than relying on headlines or analyst soundbites, builds independent judgment that holds up regardless of shifting market narratives or short-term sentiment.
Serious investment decisions depend on more than a stock price chart. Due diligence requires understanding revenue drivers, debt levels, and management’s own explanation of results, all of which live inside the annual report’s dense but revealing pages.
Warren Buffett annual reports are frequently cited as a model precisely because they reward careful readers. His approach shows that patient, literal reading of these documents, not speculation, is what separates informed decisions from guesswork.
Where to Find a Company’s Annual Report
Every publicly traded company is required to make its annual report accessible, and most make this easier than people expect. The investor relations page on a company’s own website is typically the fastest and most reliable starting point.
For U.S. companies, the SEC EDGAR database is the authoritative public source. It hosts every 10-K filing submitted to regulators, free of charge, searchable by company name, ticker symbol, or filing date going back many years.
Beyond EDGAR, many companies also post a free annual report as a downloadable annual report PDF directly on their site. This version often matches the glossy shareholder edition rather than the plainer regulatory filing format.
Non-U.S. and private companies require different research paths. Jurisdictions maintain their own registries, and access, format, and disclosure depth vary considerably depending on local securities law and whether the company sells shares publicly.
Knowing where to look saves significant time. Rather than depending on secondary summaries or financial news aggregators, going straight to the primary source ensures the information is accurate, complete, and free from interpretive bias.
Using SEC EDGAR (US Public Companies)
EDGAR search works by company name, ticker, or a unique CIK number assigned to every registered filer. Once located, a company’s full filing history appears, including every past 10-K filing search result in chronological order.
The SEC.gov interface also supports full-text search across filings, letting readers locate specific terms like “going concern” or a competitor’s name across thousands of documents. This is especially useful for comparative or investigative research.
EDGAR filings are the unfiltered, legally required version of the numbers. Because they’re regulator-facing rather than shareholder-facing, they tend to include more risk disclosure detail than a company’s polished promotional annual report.
Finding Reports for Non-US or Private Companies
The UK Companies House registry serves a similar function to EDGAR for companies incorporated in the United Kingdom, offering free access to filed accounts, though disclosure requirements differ from U.S. standards in scope and depth.
Annual report India searches typically lead to the Ministry of Corporate Affairs portal or individual stock exchange filings, since Indian public companies file with different regulatory bodies than their American or European counterparts.
Private company annual report access is far more limited. Non-public company financials aren’t required to be disclosed publicly, so private annual reports usually circulate only among lenders, investors, and internal stakeholders rather than the general public.
The Two-Part Structure of Every Annual Report
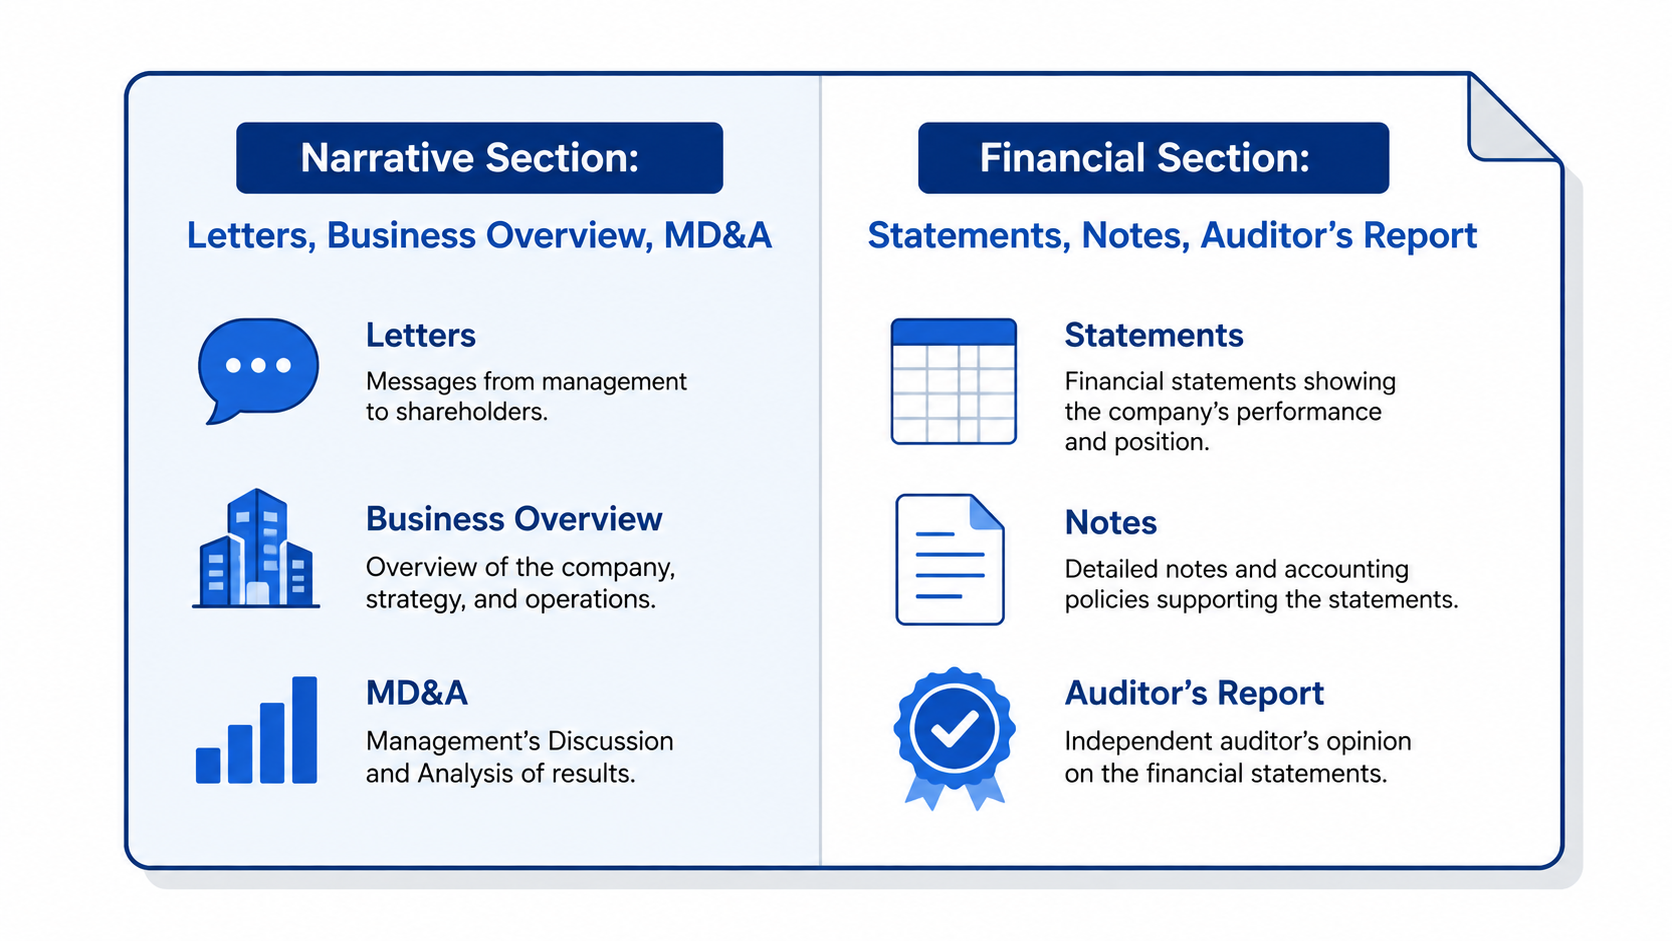
Nearly every annual report follows a recognizable annual report structure, split broadly into two halves. Understanding this division early makes the rest of the document far easier to navigate on a first read.
The front half is the narrative section. It includes the letter to shareholders, business overview, and management’s discussion of results, written in prose form and aimed at helping non-specialist readers understand context and direction.
The back half is the financial section. This is where audited statements, footnotes, and the auditor’s opinion live, presented in standardized formats that allow direct comparison against prior years and other companies in the same industry.
This front half back half of the report pattern exists for a practical reason. Narrative context shapes how the numbers should be interpreted, while the numbers themselves verify or contradict the story management is telling.
Recognizing how annual reports are organized lets readers skip around efficiently. A time-pressed reader can move straight to the financial section, while someone assessing strategy might spend more time in the narrative pages first.
How to Read an Annual Report Step by Step
There’s no single correct order, but experienced readers tend to follow a consistent annual report reading order that builds context before diving into detail. This annual report walkthrough approach turns an intimidating document into a manageable process.
The method below moves from broad narrative to granular financial detail, then circles back to governance and risk. Each step builds on the last, so skipping ahead can mean missing context needed to interpret later sections accurately.
This isn’t a rigid checklist meant to be followed mechanically. It’s a framework that experienced readers adapt based on their specific purpose, whether that’s employment research, competitive analysis, or straightforward personal investment evaluation.
Following this, how to read the annual report step by step sequence also builds a habit that compounds over time. Readers who repeat the process across companies and years develop faster pattern recognition with each report.
The seven steps that follow cover the letter to shareholders, business overview, MD&A, financial statements, footnotes, auditor’s opinion, and governance, in that specific order, each explained in its own dedicated section below.
Step 1 — Read the Letter to Shareholders
The CEO letter, sometimes called the chairman’s letter, opens nearly every annual report. It’s the most human part of the document, written in first person and intended to frame the year’s results in leadership’s own words.
Reading this section closely means paying attention to tone and language cues, not just content. Confident, specific language about challenges differs meaningfully from vague, deflective phrasing that avoids naming problems directly or minimizes disappointing results.
This letter also reveals management priorities for the coming year. What leadership chooses to emphasize, and what it chooses to leave out entirely, often says as much about the business as the financial statements that follow.
Step 2 — Review the Business Overview
The business description section explains what the company actually does, in plain terms. It typically breaks down products and services, primary markets, and how the company positions itself relative to its industry peers.
Revenue segments are usually detailed here too, showing which parts of the business generate the most income. This matters because a company can look healthy overall while individual segments are quietly declining or losing ground.
Understanding competitive positioning and the broader industry overview gives context for everything that follows. Numbers mean little without knowing whether the entire industry is growing, shrinking, or being reshaped by new competitive pressure.
Step 3 — Study Management’s Discussion and Analysis (MD&A)
The MD&A section is where management discussion and analysis explains, in narrative form, why the numbers came out the way they did. It’s often considered the most informative section for readers without a finance background.
This section provides an explanation of results, including year over year performance comparisons. Strong MD&A sections name specific drivers behind changes rather than offering generic language that could apply to almost any company’s results.
Watch closely for forward-looking statements and vague hedging. MD&A red flags include repeated blame on “macroeconomic headwinds” without specifics, or optimistic language that isn’t backed by comparable numbers elsewhere in the report.
Step 4 — Analyze the Financial Statements
The financial statements form the factual core of the report, and reading them well requires patience rather than expertise. Three statements matter most: the income statement, the balance sheet, and the cash flow statement.
Each statement answers a different question about the business. Together, they show profitability, financial position, and actual cash movement, and reading financial statements side by side prevents any single number from telling a misleading story.
The statement of stockholders equity rounds out the core financial section, tracking changes in ownership value over the year, including dividends, buybacks, and any new shares issued during the reporting period.
The Income Statement
The income statement basics start with revenue at the top and net income at the bottom, with several calculated steps in between. Gross margin shows how much profit remains after direct production costs are subtracted.
Below gross margin sit operating expenses, covering costs like marketing, research, and administration. Subtracting these from gross profit reveals operating income, a cleaner measure of the core business’s profitability before taxes and interest.
Earnings per share translates net income into a per-share figure, making it easier to compare profitability across companies of different sizes. It’s one of the most frequently cited numbers pulled from this statement.
The Balance Sheet
Balance sheet basics center on a simple equation: assets equal liabilities plus shareholders equity. This single formula must balance exactly, which is where the statement gets its name and its core discipline.
Current assets and current liabilities show short-term financial flexibility, revealing whether a company can cover near-term obligations. A widening gap between the two, in either direction, deserves closer reader attention over multiple years.
Debt levels shown on the balance sheet indicate how leveraged the company is. Rising long-term debt without a corresponding rise in earning power is often an early warning sign worth investigating further in later sections.
The Cash Flow Statement
Operating cash flow shows cash actually generated by core business activities, separate from accounting adjustments. It’s frequently viewed as a more honest profitability signal than net income alone, since cash is harder to manipulate.
Investing activities and financing activities round out the statement, covering capital expenditures, acquisitions, debt issuance, and share buybacks. These sections reveal how a company is deploying or raising money beyond day-to-day operations.
Free cash flow, calculated from operating cash minus capital spending, is why cash flow matters more than net income to many experienced readers, since it reflects money genuinely available after reinvestment needs are met.
Step 5 — Read the Notes to the Financial Statements
The footnotes section is easy to skip and expensive to ignore. These financial statement notes explain the assumptions, methods, and judgment calls behind every number reported in the main statements above them.
Accounting policies disclosed here reveal how a company recognizes revenue, values inventory, or depreciates assets. Two companies can report similar headline numbers while using very different policies underneath, changing what those numbers actually mean.
This is also where off-balance-sheet items and contingent liabilities surface, covering lawsuits, guarantees, or leases not fully reflected elsewhere. Understanding why footnotes matter often separates a surface-level reading from a genuinely thorough one.
Step 6 — Check the Auditor’s Report
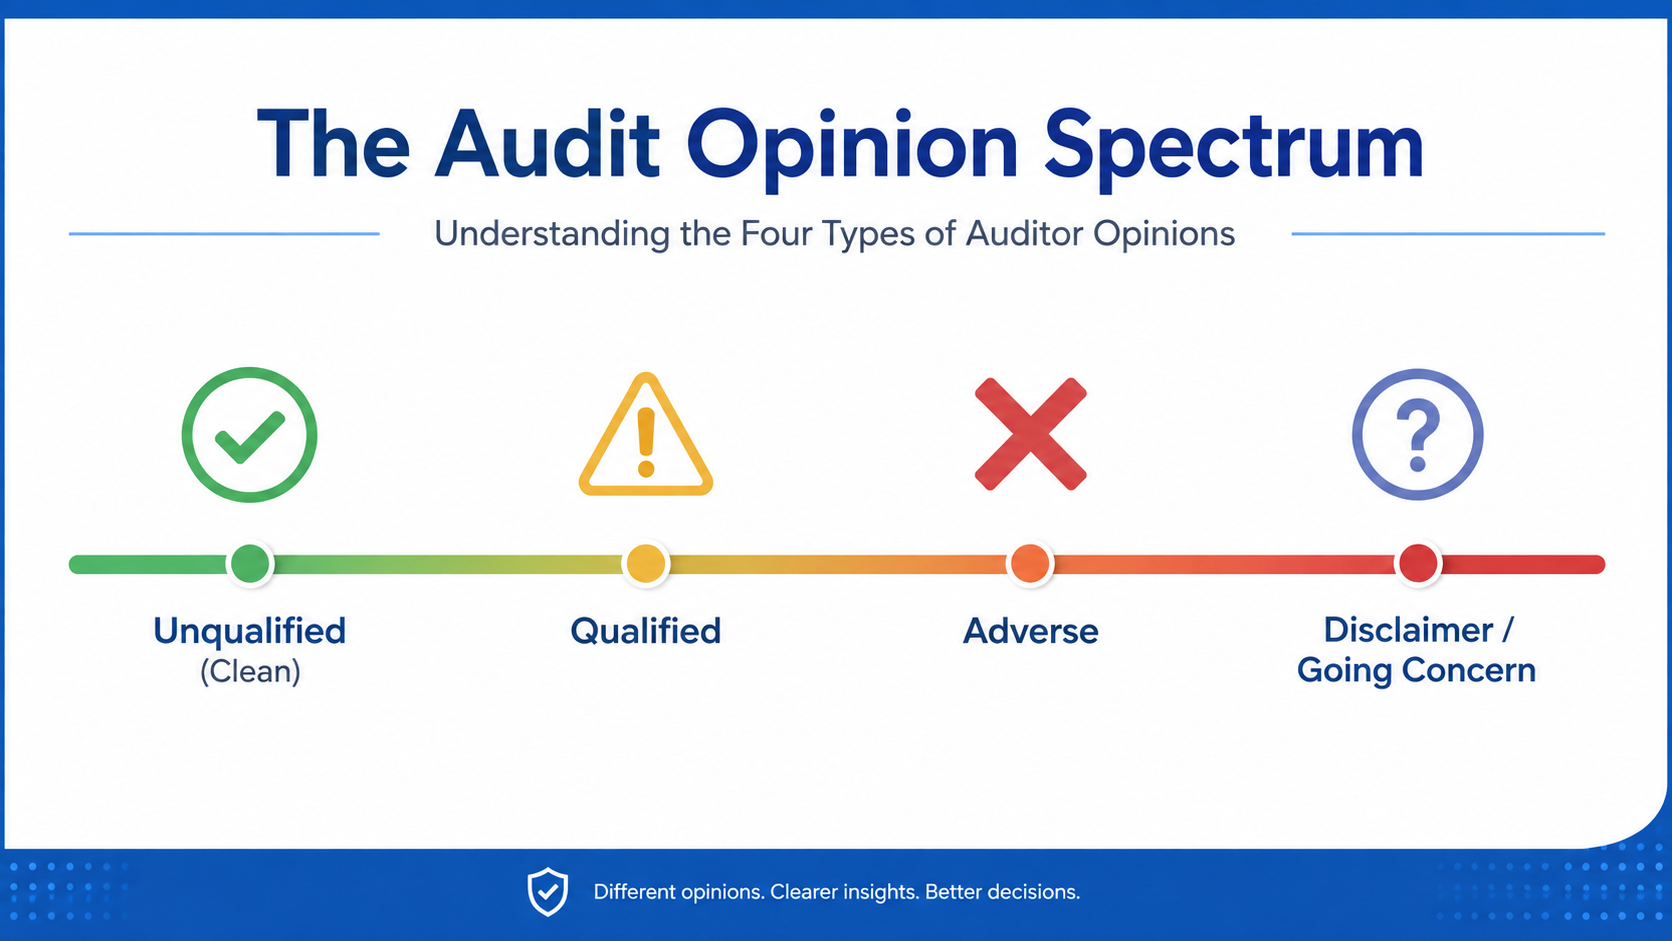
The independent auditor’s report delivers a formal opinion on whether the financial statements fairly represent the company’s position. An unqualified opinion is the standard, clean result most companies receive year after year.
A qualified opinion signals the auditor found specific exceptions worth flagging, while an adverse opinion is far more serious, stating the statements do not fairly represent the company’s actual financial condition in a material way.
A disclaimer of opinion means the auditor couldn’t reach a conclusion at all, often due to restricted access to information. Any going concern warning here is the single most serious signal this section can contain.
Step 7 — Review Corporate Governance and Risk Factors
The corporate governance report covers how the company is overseen, including details about the board of directors, their independence, and how decision-making authority is structured between the board and executive management.
Executive compensation disclosures show how leadership is paid and incentivized. Misalignment between pay structure and long-term performance metrics can hint at governance weaknesses that may not appear anywhere in the financial statements themselves.
The risk factors section lists everything management believes could hurt the business, alongside ESG disclosures and related party transactions. These sections are often boilerplate, but genuinely new risks added year over year deserve attention.
Key Financial Ratios to Calculate While Reading
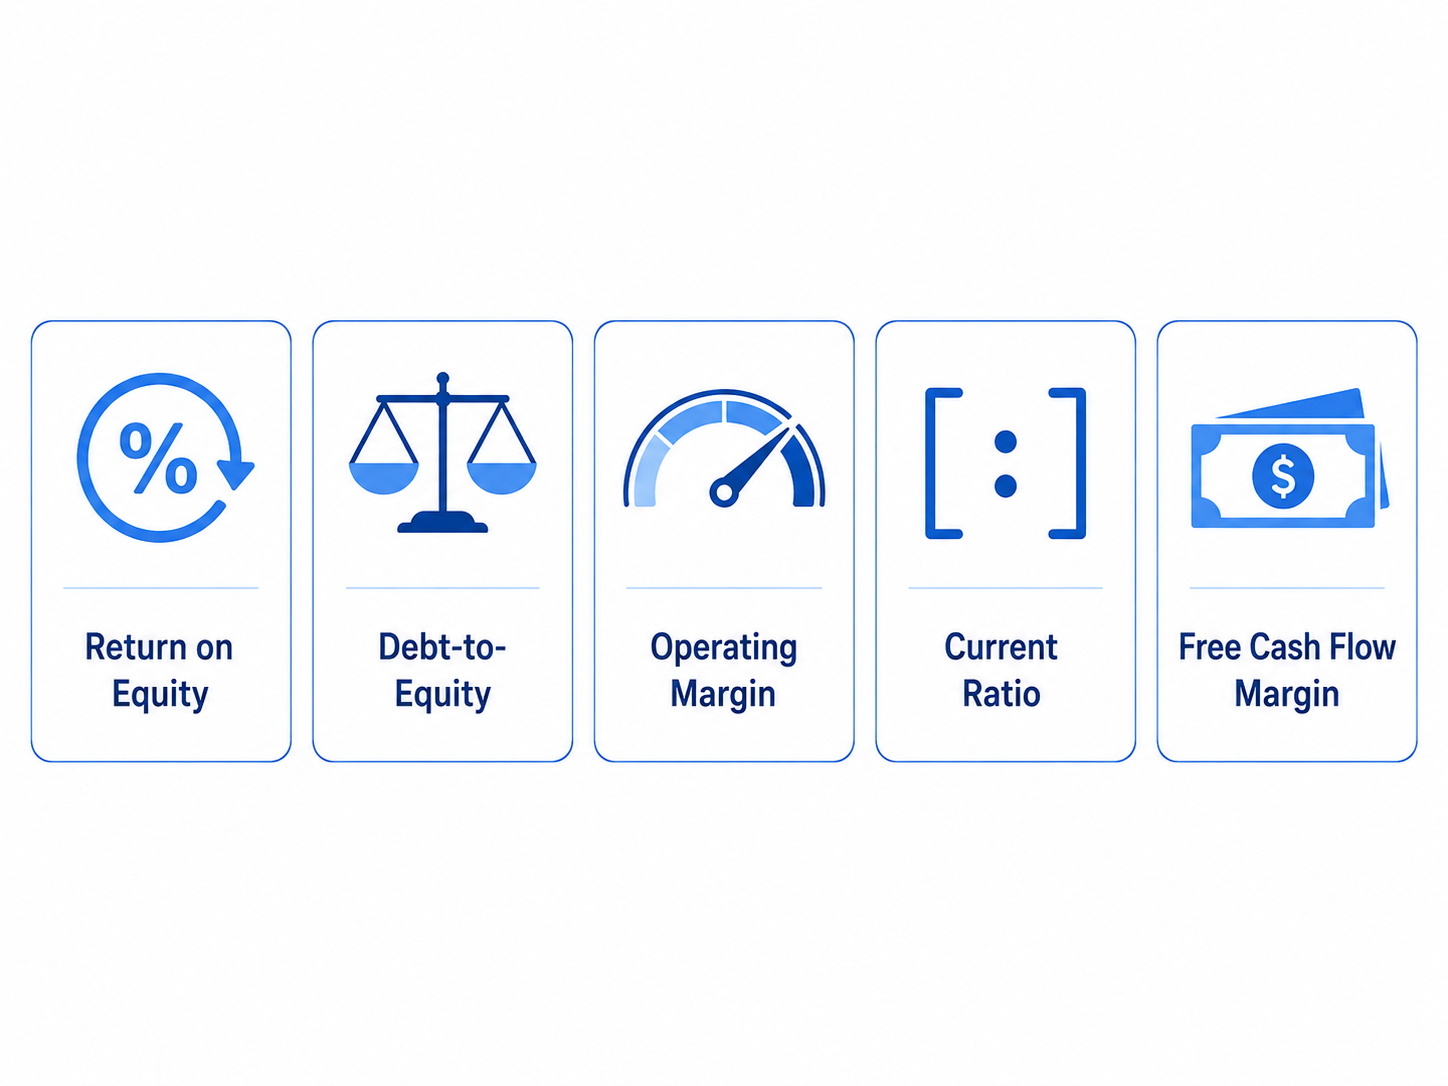
Financial ratios turn raw numbers into comparable, meaningful signals. Rather than memorizing formulas, understanding what each ratio reveals about the underlying business is what actually makes this step of the reading process useful.
ROE, or return on equity, measures how efficiently a company turns shareholder investment into profit. ROCE extends this idea further, factoring in both equity and debt to assess overall capital efficiency across the entire business.
The debt to equity ratio shows how leveraged a company is relative to its ownership base. Higher ratios aren’t automatically bad, but they do raise the stakes if earnings decline or interest rates rise.
Operating margin, current ratio, and profit margin each isolate a different dimension of performance, from operational efficiency to short-term liquidity to overall profitability, giving a fuller picture than any single figure could provide alone.
Knowing how to calculate financial ratios matters less than benchmarking ratios against peers. A ratio only becomes meaningful in context, compared against direct competitors and the company’s own historical trend over several years.
How to Spot Red Flags in an Annual Report
Learning to recognize annual report red flags is one of the most valuable skills a careful reader can develop. These warning signs rarely appear in isolation, so patterns across sections matter more than single data points.
Aggressive accounting choices, like unusually favorable revenue recognition timing, can inflate short-term results at the expense of future periods. Comparing accounting policy footnotes against prior years often reveals subtle but meaningful shifts.
Frequent auditor changes deserve scrutiny, since companies sometimes switch auditors after disagreements over how numbers should be reported. This alone isn’t damning, but paired with other signals, it becomes far more concerning.
Rising debt combined with declining cash flow despite profit is a classic mismatch worth investigating closely. It can suggest that reported earnings aren’t translating into actual cash, often due to aggressive accounting choices upstream.
Recurring one-time charges and vague MD&A language round out the common warning list. When “unusual” costs appear every year, or explanations grow noticeably less specific, both patterns are worth flagging for closer review.
How to Compare Annual Reports Across Companies and Years
Multi-year comparison is where annual report reading becomes genuinely powerful. A single year’s numbers offer a snapshot, but reviewing several years together reveals whether performance is improving, stagnating, or quietly deteriorating over time.
Trend analysis works best when applied consistently across the same metrics: revenue growth, margin stability, debt trajectory, and cash flow reliability, tracked side by side across each available reporting period for that company.
Comparing companies in the same industry requires adjusting for differences in size, accounting policy, and business model. What looks like underperformance in isolation might simply reflect a different strategic approach within the same competitive space.
An apples to apples comparison means normalizing for these differences before drawing conclusions. Ratios, rather than raw dollar figures, are usually the more reliable basis for comparing companies of meaningfully different scale.
Most experienced readers recommend a three to five year review as the minimum window for spotting genuine trends. Anything shorter risks mistaking a single unusual year for a lasting, structural pattern in performance.
Common Mistakes to Avoid When Reading an Annual Report
One of the most common mistakes reading annual reports is focusing only on net income. This single figure can be shaped by accounting choices and one-time items, making it an incomplete measure of business health alone.
Ignoring footnotes is another frequent misstep. Readers who skip straight from the income statement to the balance sheet miss the context needed to understand what those numbers actually represent beneath the surface.
Single-year analysis creates a distorted picture, since any one year can be shaped by unusual events. Without comparing several years together, it’s difficult to tell a genuine trend apart from a temporary anomaly.
Ignoring cash flow in favor of profit figures is a particularly costly mistake. Companies can report strong profits while quietly struggling with cash, a gap that only becomes visible in the cash flow statement.
Treating the glossy narrative sections as equally reliable as the audited financial statements is another trap. Marketing language is designed to persuade, while the numbers in the back half are independently verified.
A Quick 20-Minute Annual Report Scan (For Time-Pressed Readers)
Not every reader has hours to spend on a full quick annual report review. This fast annual report scan prioritizes the sections most likely to reveal meaningful information in the shortest possible reading time.
Start with the letter to shareholders for tone, then jump straight to the MD&A section. Together these two narrative pieces usually reveal whether the year was genuinely strong or being carefully reframed.
Next, scan the income statement and cash flow statement side by side, checking whether reported profit is backed by actual cash generation. A meaningful gap between the two deserves a closer second look.
Finally, check the auditor’s opinion for any qualification or going concern language, and skim the risk factors section for new additions compared to the prior year’s filing.
This 20 minute review approach for prioritizing sections won’t replace a full read for major decisions, but it offers a reliable, time-saving checklist for a first-pass assessment of any company’s report.
Frequently Asked Questions
What is the difference between an annual report and a 10-K?
A 10-K is the SEC-mandated regulatory document, filed in a strict, standardized format. An annual report can be that same document or a shorter, more polished shareholder-facing version; some companies combine both into a 10-K wrap.
Where can I find a company’s annual report for free?
The company’s own investor relations page typically hosts a free annual report as a downloadable PDF. For U.S. public companies, SEC EDGAR provides every filed 10-K at no cost, searchable by name or ticker.
How long does it take to read an annual report?
A full 10-K read can take three to five hours for a thorough pass. A focused review of key sections, using the quick annual report review method described above, typically takes thirty to forty-five minutes.
What is the most important section of an annual report?
Most experienced readers prioritize the MD&A and the cash flow statement, since both reveal operational reality beyond headline profit. That said, the most valuable section depends on whether the reader is an investor, employee, or lender.
What do the different auditor opinions mean?
An unqualified opinion is clean and standard. A qualified opinion flags specific exceptions, while an adverse opinion states the statements are materially misrepresented. A disclaimer of opinion means no conclusion was reached; going concern language is the most serious warning.
Can I read an annual report if I’m not an accountant?
Yes. No accounting background is required if the focus stays on trends, ratios, and plain-language sections like the MD&A, rather than deep technical accounting detail found in the footnotes and formal statement structures.
What red flags should I watch for in an annual report?
Watch for vague MD&A language, frequent auditor changes, rising debt paired with falling cash flow, and any qualified or adverse audit opinion. These signals are covered in more depth in the dedicated red flags section above.
How many years of annual reports should I compare?
A three to five year review is generally recommended. This window is wide enough to distinguish genuine, structural trends from a single unusual year shaped by one-time events or temporary market conditions.
Is an annual report the same as a company’s financial statements?
No. Financial statements are one component within the larger annual report, which also includes narrative sections like the letter to shareholders, business overview, and MD&A, none of which appear in the statements alone.
Do private companies publish annual reports?
Private companies aren’t required to file with the SEC, but many still produce annual reports for lenders, investors, or internal stakeholders. Private company annual report access for the general public remains limited or nonexistent.
Pingback: Discounted Cash Flow Valuation: DCF Method Explained
Pingback: Company Valuation Methods: Approaches & Formulas Explained